XRP price is trading around $1.03 , down about 5.5% on the week. The token continues to hover near the critical $1.00 support level, with traders watching for a breakout in either direction.
XRP price is trading around $1.03 , down about 5.5% on the week. The token continues to hover near the critical $1.00 support level, with traders watching for a breakout in either direction.
Analyst Celal Kucuker is back with another XRP price prediction. He’s been in financial markets for over 20 years, so I like to cover him when he publishes some high-quality XRP price analysis.
This time, he tied his forecast to specific targets for Bitcoin and Ethereum.
Kucuker: “$6 XRP When BTC Hits $120K and ETH Hits $6K”
Celal Kucuker posted a bold and direct XRP price outlook. He tweeted:
“If BTC hits $120K and ETH hits $6K, XRP WILL hit $6. In a MEGA bull run, XRP will push $11–$15. No ‘maybe.’ No ‘if.’ XRP is the altcoin I trust the most.”
The statement is notable for its certainty. Kucuker is not hedging. He is not saying “could” or “might.” He is stating it as a fact.
The $6 target is tied to specific Bitcoin and Ethereum price levels. The $11–$15 target is reserved for a “mega bull run” scenario, which aligns with the top of the dashed channel on his chart around 2027–2028.
The XRP Chart: A Multi-Year Wedge Structure
The weekly XRP/USD chart Kucuker shared is a long-term technical analysis with a lot of annotation – some standard, some speculative.
What’s objectively on the chart:
- Price is currently around $1.03, down about 5.5% on the week
- A multi-year rising wedge and ascending broadening structure drawn from 2013 through a projected 2028+ target
- Standard price-action labels: HH (higher high), HL (higher low), LH (lower high), LL (lower low), BOS (break of structure), CHoCH (change of character), EQH/EQL (equal highs and lows)
- A green ascending support zone connecting lows from 2015 through the present
- An RSI panel at the bottom showing oscillating momentum, currently mid-range
- Volume histogram showing the largest spike around 2020-2021
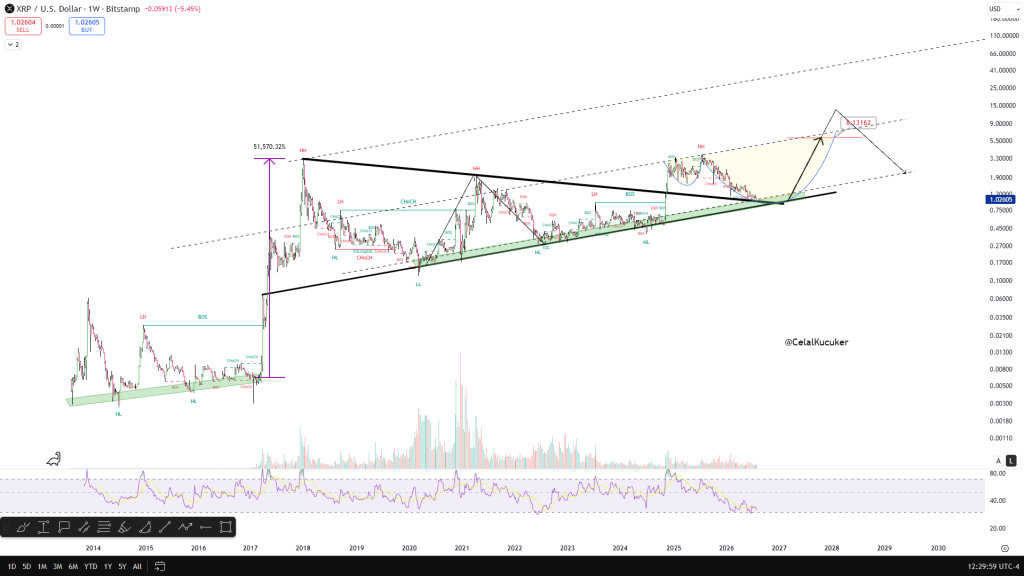
Source: X/@CelalKucuker
What the chart shows target-wise:
The highest price level the drawn wedge and projection touches is around the $9–$15 range, right at the 2027–2028 area on the right side of the chart – which lines up with the $11–$15 figure in the tweet.
The “51,570.32%” text with the purple arrow near the 2017 low is a TradingView measurement tool artifact – it is a historical measurement of the percentage gain between two points (likely the 2017 low to the 2021 high), not a forward XRP price target. My earlier read conflated that with a forecast.
Actual claims, cross-referencing chart and tweet:
- Conditional claim: BTC $120K + ETH $6K → XRP hits $6 (stated as inevitable, “no maybe, no if”)
- “Mega bull run” scenario: XRP $11–$15, which matches the top of the dashed channel and arrow on the chart around 2027–2028
Read also: What $10,000 in XRP Today Could Be Worth by Late 2027
A Few Things Worth Flagging
The conditional logic is not actually derived from the chart. The XRP chart is a technical and price-structure argument (wedges, BOS, CHoCH). The $6 target tied to BTC and ETH prices is a correlation argument, not something you get from the wedge geometry itself. They are two different methodologies stapled together.
“WILL” and “no maybe, no if” is promotional language, not analytical language. Legitimate technical analysis deals in probabilities and invalidation levels, not certainties.
The chart’s own drawing shows a decline back to roughly $2 after the 2028 peak. So even by the chart’s own logic, the $11–$15 zone is a temporary high, not a stable target.
XRP News: ETF Inflows and Clarity Act Delay
After a period of muted activity, U.S. spot XRP ETFs saw net inflows of $3.45 million on August 6. Bitwise’s XRP fund led with $2.89 million , followed by Franklin Templeton’s XRPZ. This reversed prior outflows, bringing total net assets for these funds to $964.21 million.
The U.S. Senate has delayed a vote on the CLARITY Act (a market structure bill seen as beneficial for XRP) until at least September 2026. This postponement has contributed to recent price weakness, pushing the XRP price toward the $1.00 support level as hopes for near-term regulatory clarity fade.
This is pretty bearish for XRP because it extends the period of regulatory uncertainty. The delay is a headwind for any near-term rally.
Subscribe to our YouTube channel for daily crypto updates, market insights, and expert analysis.
The post XRP Price Prediction if Bitcoin Hits $120K and Ethereum Hits $6K appeared first on CaptainAltcoin.