XRP is sitting at a make-or-break spot on the charts. The token is trading around $1.02 to $1.03, right on top of a support zone that has held since late June. This is not a small moment for
XRP is sitting at a make-or-break spot on the charts. The token is trading around $1.02 to $1.03, right on top of a support zone that has held since late June.
This is not a small moment for XRP holders. A break below this level could open the door to a much deeper drop, while a bounce could send prices back toward $1.15 or higher.
Right now, the broader picture is mixed. There is bullish news from the XRPL and steady ETF inflows. But the price chart itself is telling a more cautious story.
What is XRP's price doing right now?
Looking at the daily chart, the altcoin has been sliding lower since February. Price fell from highs near $1.90 down to the current range close to $1.02.
Along the way, a clear pattern has formed. Traders call it a descending triangle. It is made up of lower highs on top and a flat support line on the bottom, currently sitting around $1.00 to $1.02.
This kind of setup is usually seen as bearish. It suggests sellers are slowly gaining control, even as buyers keep defending the same floor.
The 20-day moving average and the 50-day average are both sloping downward, sitting above the current price. That adds more weight to the idea that the short-term trend is still tilted down.
Why does the $1 support level matter for XRP?
The $1.00 to $1.02 zone is not random. The altcoin bounced hard from this same area in late June, rallying to around $1.15 before rolling over again.
That history makes this level important. If buyers step in again, the price could see a similar bounce toward the $1.10 to $1.15 range.
But if the support breaks, the setup points to a possible slide toward $0.65, based on the weekly chart structure. That would mark a drop of roughly 35% from current levels.
What does the RSI say about XRP momentum?
The Relative Strength Index (RSI) on the daily chart is reading around 39. This sits below the neutral 50 mark, showing that momentum still favors sellers.
An RSI near 39 is not yet in oversold territory, which usually starts closer to 30. That means there could be more room for prices to drift lower before a strong bounce becomes likely.
Still, RSI readings can turn quickly. A short-term bounce from oversold conditions is common, even inside a larger downtrend.
XRP Technical Snapshot
Metric
Value
Current Price
~$1.02–$1.03
24H Range
$1.02–$1.04
Key Support
$1.00–$1.02
Resistance (trendline)
$1.10–$1.15
RSI (14-day)
39
Pattern
Descending Triangle
Downside Target if Broken
$0.65
Upside Target if Reclaimed
$1.20–$1.25
Are there any bullish signs for XRP right now?
Away from the charts, there is some positive news. The XRP Ledger rolled out version 3.3.0 this week, adding proposed amendments including a privacy-focused update aimed at institutional users.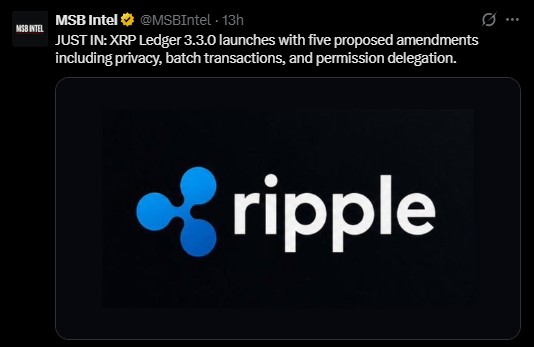
That update, along with batch transactions and permission delegation features, is being pitched toward funds and larger financial players already using tokenized assets on the network.
On the ETF side, spot XRP funds added roughly $1.01 million over the past week. That is smaller than the prior week's inflows, but it still marks continued, if slower, institutional interest.
Some chart watchers are also pointing to a longer-term pattern that, if it eventually breaks out, could target levels of $15, far above current prices. That kind of setup remains speculative and would need a confirmed breakout first, not just a bounce off support.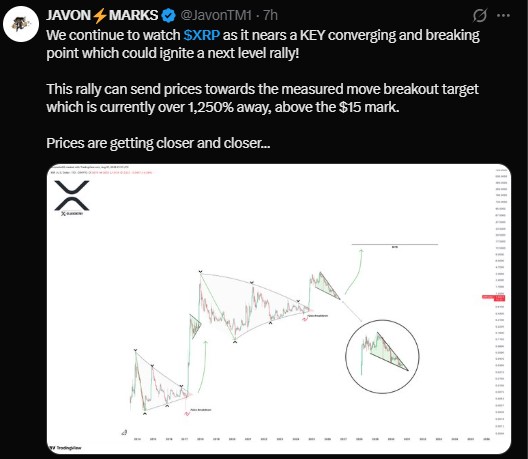
What could move XRP price next?
A few factors are worth watching in the days ahead.
First, whether the $1.00 to $1.02 support holds again like it did in June. Second, whether the descending trendline resistance near $1.10 to $1.15 gets broken to the upside.
On the policy side, the US Senate wrapped its last pre-recess session without moving the CLARITY Act forward. Regulatory clarity remains an open question for the wider crypto market, XRP included.
The bottom line for traders
XRP price is at a genuine crossroads. The descending triangle pattern and weak RSI reading lean bearish in the short term.
At the same time, the same support zone has proven it can hold and even trigger a bounce before. Network upgrades and steady ETF demand offer some counterbalance to the technical weakness.
Traders will likely be watching this $1.00 to $1.02 zone closely over the coming sessions to see which side wins out.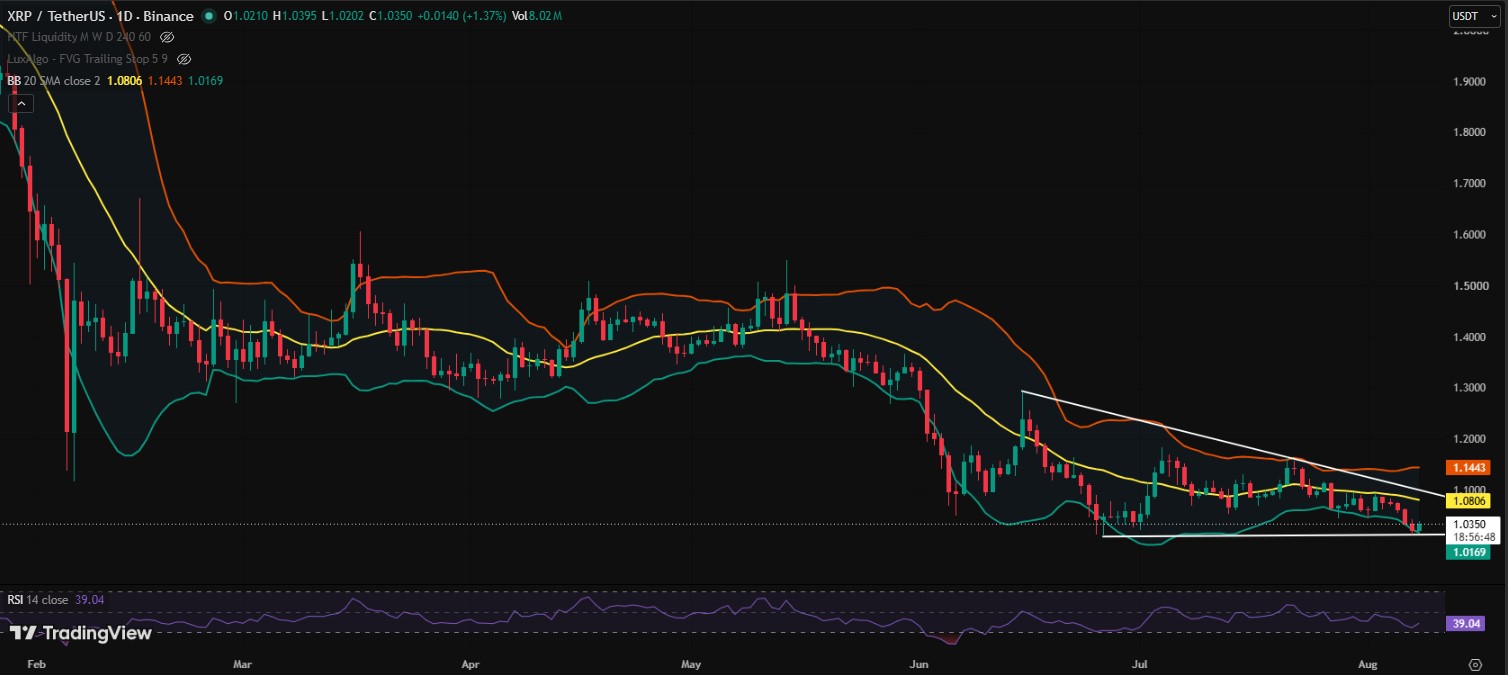
Disclaimer
This article is for informational purposes only and does not constitute financial, investment, or trading advice. Cryptocurrency markets are highly volatile and carry significant risk. Always do your own research and consult a licensed financial advisor before making investment decisions.