XRP is trading near $1.3005, down about 2% on the day. The token is holding just above the $1.30 support level while the wider crypto market cools. Futures trading has picked up, though. Mont
XRP is trading near $1.3005, down about 2% on the day. The token is holding just above the $1.30 support level while the wider crypto market cools.
Futures trading has picked up, though. Monthly volume has reached its highest level in seven months. Price has not followed it higher.
Why Is the Crypto Market Down Today?
The US central bank left its benchmark rate unchanged on October 28, 2026. The fed funds target range stays at 3.75% to 4%.
The Fed's tough tone a day earlier added to the pressure on risk assets.
The total crypto market cap fell 0.77% to $2.69 trillion. Bitcoin slipped below $80,000, while Ethereum held above $2,300.
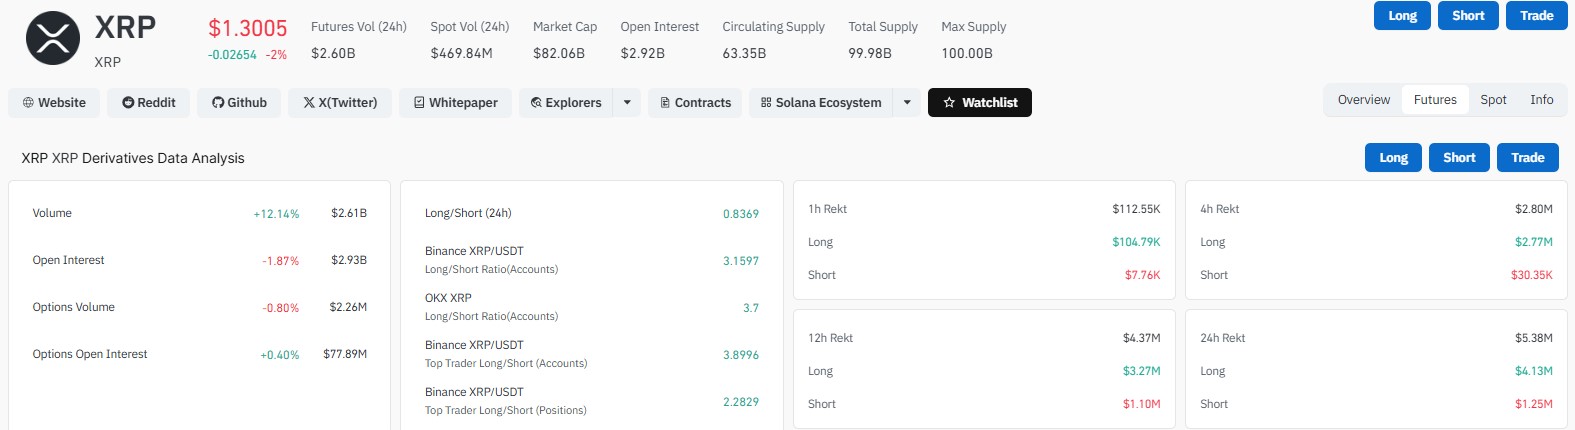
The token's own market cap is $82.06 billion. About 63.35 billion coins are in circulation out of a 100 billion max supply.
What Did Brad Garlinghouse Say About XRP?
Ripple CEO Brad Garlinghouse spoke at Swell 2026. He said the company will keep backing the token and dismissed rumors that Ripple might cut its focus.
He also called the RLUSD stablecoin a partner to the token, not a replacement.
Ripple is still the largest holder. Garlinghouse said the plan is to make the asset more useful, more liquid, and more trusted.
His message was simple. Ripple is building the infrastructure, and now the token needs to capture the opportunity.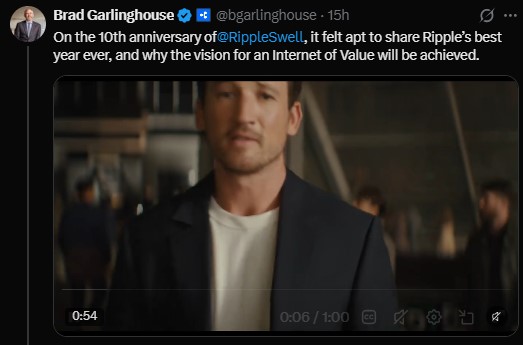
Why Is Futures Trading Volume Rising?
Monthly futures volume reached roughly $69 billion by the end of October, based on the chart shared by Arab Chain. That is the highest since March.
For context, volume was near $120 billion in November 2025. It fell to about $38 billion in July before climbing again.
Binance leads the pack by a wide margin.
Exchange
Monthly Futures Volume
Binance
$34.57 billion
Bybit
$13.58 billion
OKX
$12.25 billion
More volume does not always mean a higher price. It only shows how busy the market is.
The jump could come from heavy speculation, forced liquidations, or buyers and sellers fighting at key levels. If traders keep adding shorts, price can stay stuck in a range.
Rising volume with real buying demand could help price move up. Rising volume with no gains may point to selling pressure.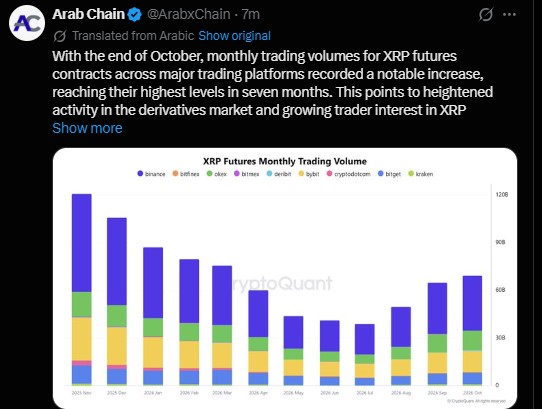
What Does the Derivatives Data Show?
Futures volume over 24 hours is about $2.60 billion, up 12.14%. Spot volume is $469.84 million.
Open interest is $2.93 billion, down 1.87%. That means fewer active futures positions.
Metric
Value
Long/Short Ratio (24h)
0.8369
Binance XRP/USDT (Accounts)
3.1597
OKX XRP (Accounts)
3.7
Binance Top Traders (Accounts)
3.8996
Binance Top Traders (Positions)
2.2829
Options Volume
$2.26 million (-0.80%)
Options Open Interest
$77.89 million (+0.40%)
The overall ratio below 1 leans short. Still, Binance and OKX show more long accounts than short ones. The signals are mixed.
Long traders took the bigger hit on liquidations.
Period
Total
Long
Short
1 hour
$112.55K
$104.79K
$7.76K
4 hours
$2.80M
$2.77M
$30.35K
12 hours
$4.37M
$3.27M
$1.10M
24 hours
$5.38M
$4.13M
$1.25M
What Does the XRP Chart Say?
On the daily XRP/USDT chart, price moves inside a descending channel. It keeps making lower highs and has not broken the trendline.
Price sits below all four moving averages.
EMA
Level
20
$1.3379
50
$1.3577
100
$1.3331
200
$1.3701
The RSI reads about 41, under the neutral 50 mark. That fits a weak trend.
Today's candle opened at $1.3260 and hit a high of $1.3269. It dipped to $1.2867 and closed near $1.3005, down 1.92%.
What Are the Key Support and Resistance Levels?
Level
Zone
What It Means
Support
$1.25
Buyers must defend this area
Support
$1.20
Next stop if $1.25 breaks on a daily close
Resistance
$1.34 to $1.38
Channel top and EMA cluster
Resistance
$1.40 to $1.45
Possible recovery zone
A daily close below $1.25 could open the way to $1.20.
If price holds $1.25 and clears the channel near $1.34 to $1.38, a bounce toward $1.40 to $1.45 may follow. A break above $1.38 would be the first sign of a trend change.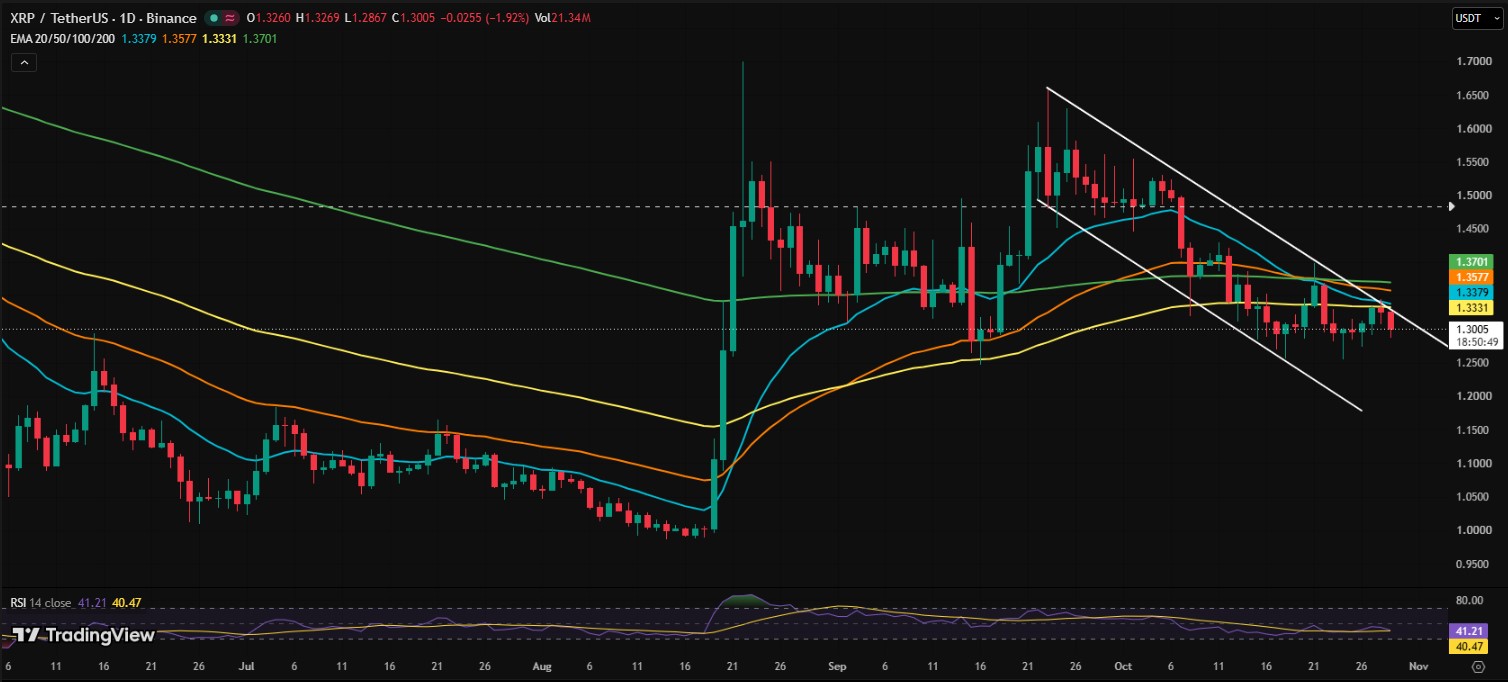
Will XRP Go Up or Down From Here?
Right now, the data leans bearish to sideways. Open interest is falling, longs are getting flushed, and price is under every key average.
A recovery is still possible if buyers step in and positioning settles. Nobody knows for sure, so it is better to watch the $1.25 and $1.38 levels than to guess.
Disclaimer
This article is for information only. It is not financial, investment, or trading advice. Crypto assets are volatile, and you can lose money. Do your own research and speak with a licensed financial adviser before you invest.