$ZAMA It just touched a fresh all-time high near $0.06514 before getting rejected hard, breaking the rising trendline that carried it there in the first place. Zama is a project building full
$ZAMA It just touched a fresh all-time high near $0.06514 before getting rejected hard, breaking the rising trendline that carried it there in the first place.
Zama is a project building fully homomorphic encryption technology aimed at enabling confidential computing on blockchain, and its own data shows 63% of circulating supply is currently staked.
This Zama Price Prediction looks at whether this pullback is a healthy reset or the start of something bigger. Keep reading to see how the levels stack up.
ZAMA Price Today: Market Overview
Metric
Value
Price (ZAMA/USD)
$0.05131
24h Change
+2.5%
24h Range
$0.05035 - $0.0642
Market Cap
$124.8M (+8.04%)
Unlocked Market Cap
$145.98M
Fully Diluted Valuation
$634.52M
24h Trading Volume
$136.51M (-7.47%)
TVL
$48.07M
Circulating Supply
2.2B $ZAMA
Total Supply
11.19B $ZAMA
Max Supply
Uncapped
Holders
7.94K
Source: Data from CoinMarketCap as of July 25, 2026. Figures may vary slightly across other tracking websites.
ZAMA crypto news: Latest Update
Zama's official account announced that this coming Monday, July 27, it will release the Q2 edition of "Shielded," a report tracking Zama Protocol network health, confidential token adoption, and the ecosystem of institutions and developers building on its confidential computing protocol, produced together with @therollupco. 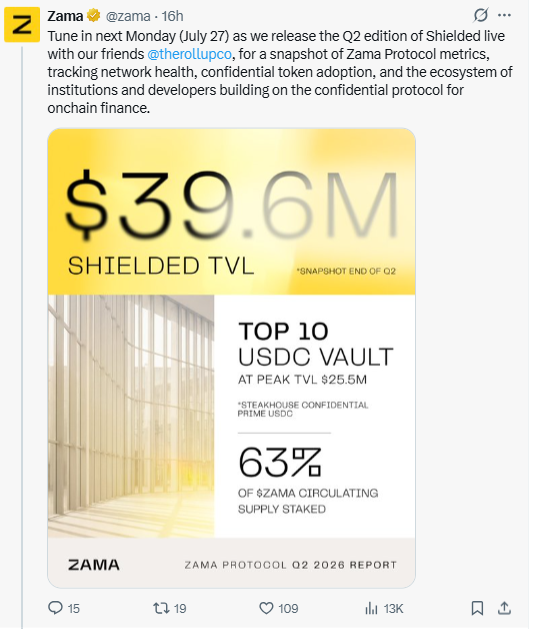
Alongside the announcement, Zama shared a preview snapshot from the end of Q2: total Shielded TVL at $39.6M, the top 10 USDC vaults peaking at $25.5M TVL, and 63% of the circulating $ZAMA supply currently staked.
Separately, Zama also announced the winners of its Mainnet Season 3 Developer Program bounty track, where builders created apps on top of Zama's official Wrapper Registry: cToken by @realchriswilder, Vesper by @harsh1900h, and Blackout by @saitama_xc. Both updates are official Zama Protocol announcements.
ZAMA Whale Concentration: On-Chain Holder Data
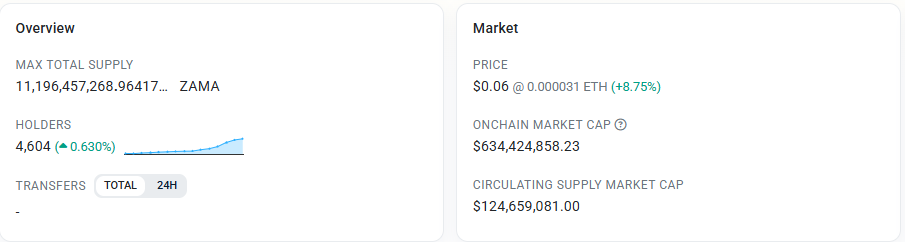
Etherscan data for the $ZAMA contract shows a max total supply of roughly 11.2B tokens and 4,604 holders on this chain, with an on-chain market cap of $634,424,858.
This holder count differs from the 7.94K figure in the price tracker above, likely because $ZAMA is tracked across multiple chains.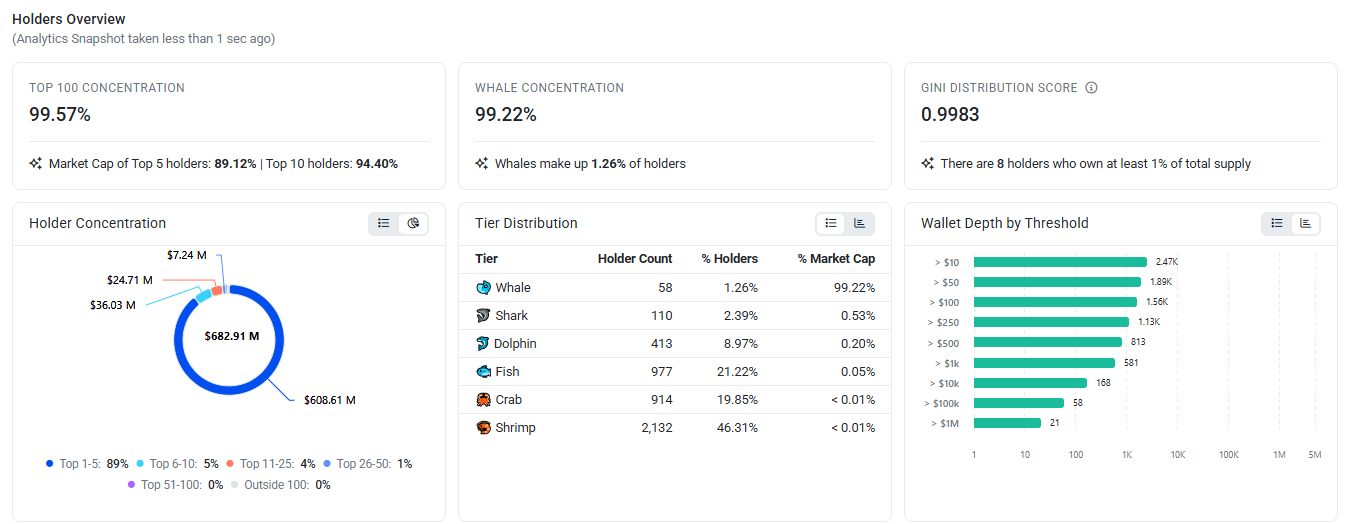
Concentration is extreme by the numbers: the top 100 wallets hold 99.57% of supply, whales alone (1.26% of all holders) control 99.22%, and the Gini score sits at 0.9983, with 8 wallets each owning over 1% of supply.
The top 5 wallets hold 89.12% of market cap.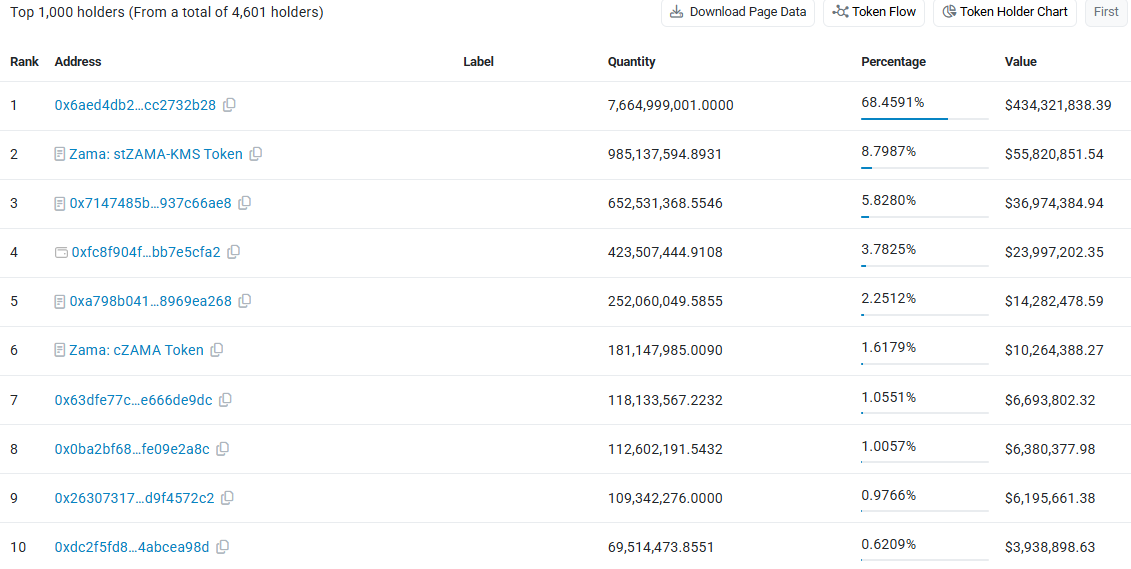
This needs context, though. Several of the largest holders are official protocol contracts rather than personal wallets.
The #2 holder (8.80% of supply) is labeled "$Zama: stZAMA-KMS Token," a staking contract, and the #6 holder (1.62%) is labeled "Zama: cZAMA Token," a confidential token wrapper.
The single largest address (68.46% of supply, unlabeled) is likely a treasury, vesting, or bridge contract given its size. A meaningful share of this concentration reflects protocol design; staking currently holds 63% of supply per $Zama's own data, rather than pure speculative whale hoarding.
Source: Data from Etherscan as of July 25, 2026.
ZAMA Forecast 2026: Chart Analysis
Pair: $ZAMA/USDT | Exchange: KuCoin | Timeframe: 1H | As of: July 25, 2026, 15:20 UTC+5:30
$ZAMA spent July 20-22 in a tight sideways box, roughly around $0.04127, and then broke out sharply, riding a steep rising trendline through July 23 into today.
That rally pushed the price to a fresh all-time high of $0.06514 before a sharp reversal candle dropped the price 10.19% to $0.05131, decisively breaking the rising trendline that had supported the entire move.
The EMA readings (20: 0.05594, 50: 0.05319, 100: 0.04934, and 200: 0.04458) show the current price now sitting below the 20 and 50 EMA, though still above the 100 and 200 EMA, meaning the broader uptrend structure hasn't fully broken, but short-term momentum has clearly turned. 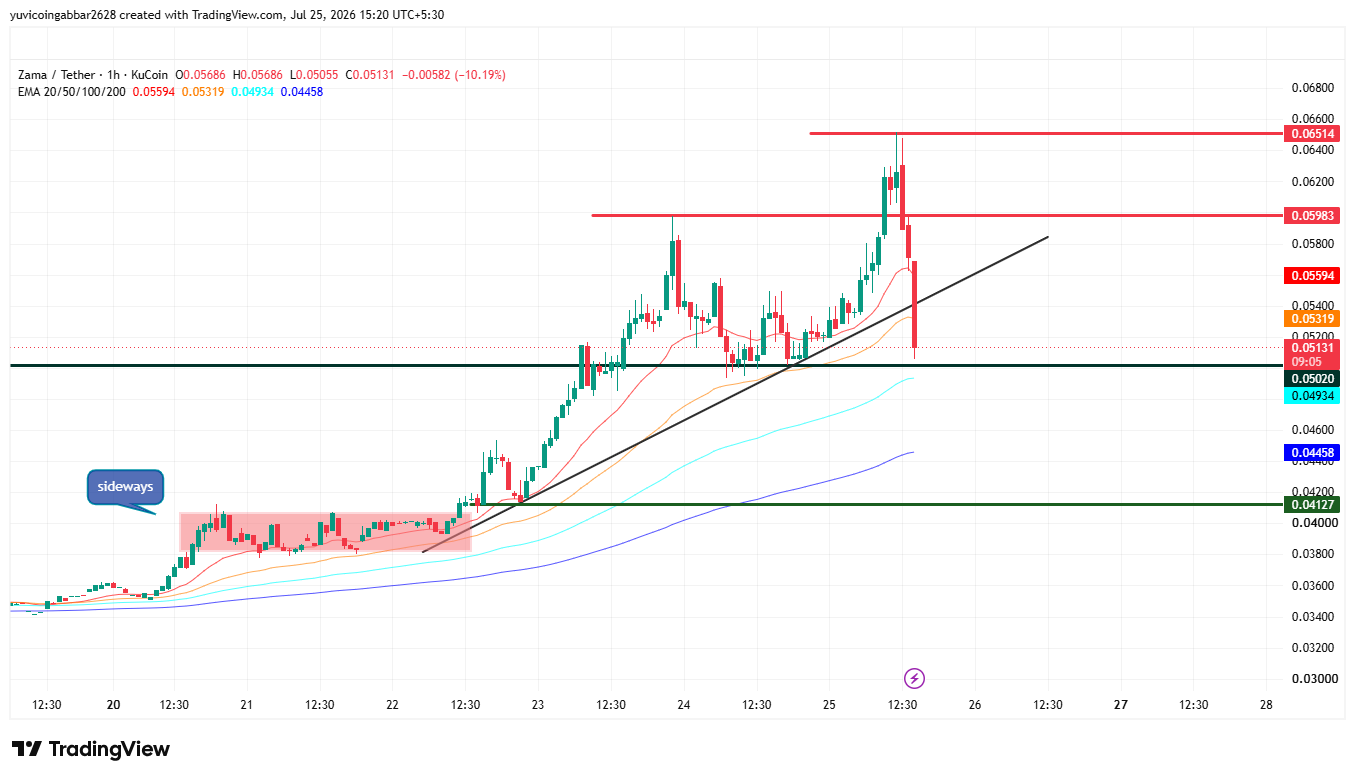
The $0.0502 level, which was resistance before the breakout, is now the first real test of whether this pullback holds as a normal retracement or turns into a deeper reversal.
Level
Price
Type
All-time high
$0.06514
Fresh ATH, hit earlier today
Resistance
$0.05983
Prior swing high before the pullback
Immediate price reference
$0.05131
Current price, sharply down from ATH
First support
$0.05020
Former resistance, now key retest zone
Deeper support
$0.04127
Former sideways box floor
ZAMA Price Prediction: Price Scenarios
Scenario
Target
Probability
Trigger
Confirmation Level
Timeframe
Invalidation Level
Bullish
$0.05983
30%
Daily close back above $0.0502 with rising volume, treating the drop as a shakeout
Reclaim and hold above $0.0502 for 2+ candles
3 to 7 days
Close back below $0.04127
Base Case
$0.04127 to $0.0502
45%
Price consolidates while the market digests the ATH rejection
Price holding inside the range for several sessions
3 to 7 days
Daily close outside either side of the range
Bearish
$0.04127
25%
Break below $0.0502 fails to hold, confirming the trendline break as a genuine reversal
Daily close below $0.0502 on rising volume
3 to 7 days
Reclaim of $0.0502 on rising volume
Probability weighting favors the base case since the broader uptrend (price above the 100 and 200 EMA) is still technically intact, but the size of today's reversal candle and the confirmed trendline break keep the bearish case elevated above a typical pullback scenario.
Can ZAMA Reach $0.05983 Again?
A retest of $0.05983 is possible within the bullish case, but it depends on $ZAMA first reclaiming and holding the $0.0502 zone, the same level that acted as resistance before the original breakout.
Without that reclaim, a retest of the recent highs looks unlikely in the short term.
What Could Invalidate the Bullish Setup?
The bullish case would be invalidated by a daily close below $0.04127, the former sideways box floor.
A failure to hold $0.0502 on the first retest, combined with fading volume, would also be an early warning sign that buyers are not stepping back in.
Two Scenarios: Bounce vs Breakdown
Bounce scenario: If ZAMA reclaims $0.0502 and holds it on rising volume, the pullback would likely be read as a normal shakeout after a parabolic move, opening the path back toward $0.05983.
Invalidation for this view is a close back below $0.04127.
Breakdown scenario: If $0.0502 fails to hold, ZAMA risks a deeper slide toward the $0.04127 zone, which would suggest the ATH rejection and trendline break mark a genuine shift rather than a temporary pullback.
Invalidation for this view is a reclaim of $0.0502 on rising volume.
Risks Traders Should Watch
ZAMA just posted a 10%+ single-candle reversal right after a fresh all-time high, which is a classic sign of a crowded, leveraged move unwinding quickly.
The extreme on-chain concentration, even accounting for staking contracts, means large holder activity could add further volatility in either direction. Treat any bounce attempt with caution until $0.0502 is reclaimed and held.
ZAMA Market Outlook: Expert View
According to CoinGabbar analyst, this looks like a classic post-ATH shakeout so far rather than a confirmed trend reversal since the price remains above both the 100 and 200 EMA even after the drop.
That said, the size and speed of the reversal candle, combined with the broken rising trendline, means the $0.0502 retest carries real weight.
The upcoming Q2 Shielded report on July 27 could also become a fresh catalyst depending on what it reveals about protocol adoption, separate from the pure technical setup.
Disclaimer: This article is for informational purposes only and should not be considered financial or investment advice. Cryptocurrency markets are highly volatile, and prices can change rapidly based on market conditions. Readers should conduct their own research and consult a qualified financial advisor before making any investment decisions. CoinGabbar does not guarantee the accuracy of price predictions, and past performance is not indicative of future results.