The data recorded on blockchains often gives the impression of providing an accurate reading of financial flows. However, a study by the Bank for International Settlements (BIS) shows that ce
The data recorded on blockchains often gives the impression of providing an accurate reading of financial flows. However, a study by the Bank for International Settlements (BIS) shows that certain metrics can vary depending on the method used. For Bitcoin, researchers noted a gap of up to six times in the estimation of the value of transfers made on the blockchain. This difference does not concern exchanges carried out on platforms, but rather the interpretation of transactions recorded directly on the network.
In Brief
- The BIS reveals that estimations of onchain transfers can vary up to six times depending on the method used.
- Change outputs in transactions complicate the interpretation of flows actually sent to third parties.
- Conventional market capitalization can reach four times the realized capitalization.
- The study calls for considering onchain metrics as approximations rather than direct measurements.
Transfers Difficult to Measure Precisely
The BIS study first highlights the limitations related to Bitcoin transaction structure. When a user spends funds, the unused part can return to their own address as change. This output can then appear as a transfer, although it does not correspond to a payment intended for a third party. The calculated value therefore depends on how these movements are treated.
According to the researchers’ analysis, these methodological choices can cause considerable discrepancies between different estimates. In some cases, the value of bitcoin transfers on the blockchain varies up to six times depending on the method chosen. This difference concerns on-chain flows. The raw data remains identical, but its interpretation changes according to the rules.
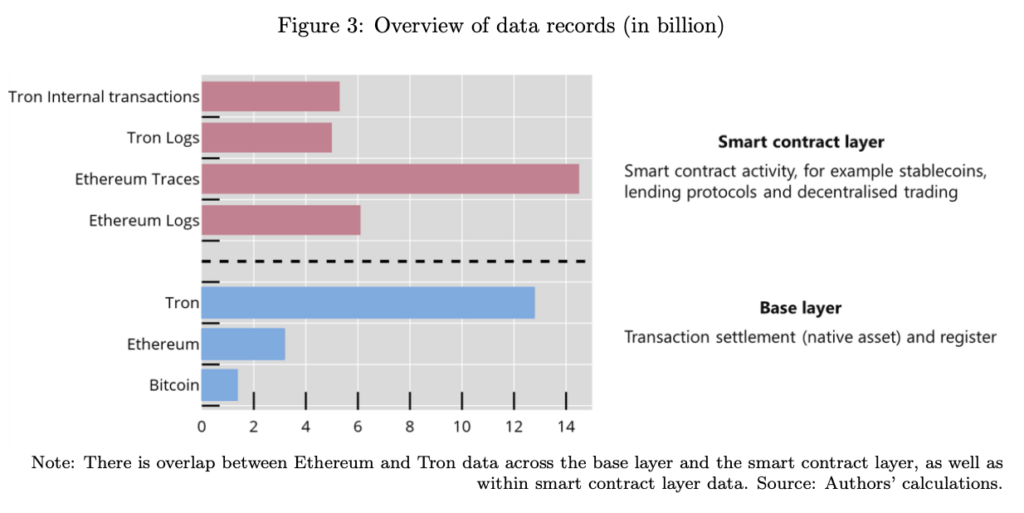 Distribution of blockchain records analyzed in the BIS study. Source: BIS
The BIS also emphasizes here that several indicators sometimes give an impression of greater precision than the data allows. Transaction volumes, market capitalization, and total value locked thus present interpretation limits. The researchers consider on-chain metrics as approximations. This distinction matters for analyzing the actual uses of a network.
Your 1st cryptos with KuCoinThis link uses an affiliate program.Market Capitalization Also Shows a Difference
The issue is not only about bitcoin transfers. The study also notes a gap between conventional market capitalization and realized capitalization. The latter values each unit according to its last transaction price, whereas the conventional measure relies on another approach. Conventional capitalization has sometimes reached four times the realized capitalization.
These results come from an analysis of 100 billion blockchain records from Bitcoin, Ethereum, and Tron. The sample shows that these difficulties more broadly concern data produced by the different networks studied. Consequently, comparing indicators requires considering their construction method.
Ethereum adds a difficulty with the proliferation of smart contracts. Out of about 67.5 million active contracts examined, nearly 54 million could not be categorized according to the criteria chosen by the study. This situation complicates the interpretation of blockchain activity. Researchers thus observe similar challenges for Bitcoin in several segments of the crypto ecosystem.
Stablecoins Illustrate the Limits of Raw Data
The USDT analysis shows why the same data can hide different economic uses. On Ethereum, USDT appears more linked to decentralized finance, while the one present on Tron is more associated with payments and store of value. Holdings in smart contracts reinforce this difference. On Ethereum, their share exceeded 20% in 2022, compared to about 1% on Tron.
For researchers, aggregating Bitcoin and USDT activity across multiple blockchains can mask these usage differences. A single global metric can combine operations related to DeFi, payments, or value preservation. The study urges looking at the context of each transaction. This approach better distinguishes technical activity from economic activity.
Some tools already apply this separation. Visa, with its Onchain Analytics dashboard powered by Allium Labs, presents stablecoin transaction volumes in two forms. The adjusted volume reduces some distortions, notably bots, high-frequency trading, bridges, and internal operations. The dashboard currently shows 6.4 trillion dollars of transactions tracked over 30 days, compared to 313.1 billion after adjustment.
In the short term, the study could increase attention paid to blockchain data calculation methods. On-chain metrics will remain useful, but their scope will depend on the treatment applied to transactions. For bitcoin, distinguishing technical movements from economic transfers could remain central.