The latest Aave price prediction is rising after AAVE gave back much of its weekend rally. The AAVE coin is down 4.4% over the last 24 hours, and traders want to know whether buyers can step
The latest Aave price prediction is rising after AAVE gave back much of its weekend rally. The AAVE coin is down 4.4% over the last 24 hours, and traders want to know whether buyers can step in at this level. $AAVE now trades near $131.21.
Aave started as ETHLend in 2017 and took its current name in 2020. The protocol lets users lend and borrow crypto, and AAVE is its governance token.
According to CoinGecko,Aave price today is $131.21, within a 24-hour range of $130.76 to $138.95. AAVE ranks 46th by market capitalization at about $2.027 billion.
Live Aave Market Data
Metric
Value
AAVE Price
$131.21
24h Change
-4.4%
24h Range
$130.76 to $138.95
Market Cap
$2.027B
Market Rank
#46
Source: CoinGecko, as of November 2, 2026.
AAVE Technical Analysis
AAVE/USDT hourly chart on Binance showing a falling wedge and a Wolfe wave with support at 129.49, 127.30 and 124.27 and resistance at 133.28, 136.69 and 141.23
This Aave price prediction for November 2 reads the hourly AAVE/USDT chart on Binance.
Price rallied from near $117 on October 30 to a high of $141.23 on November 1. It has since slid inside a falling wedge, and both trendlines slope down.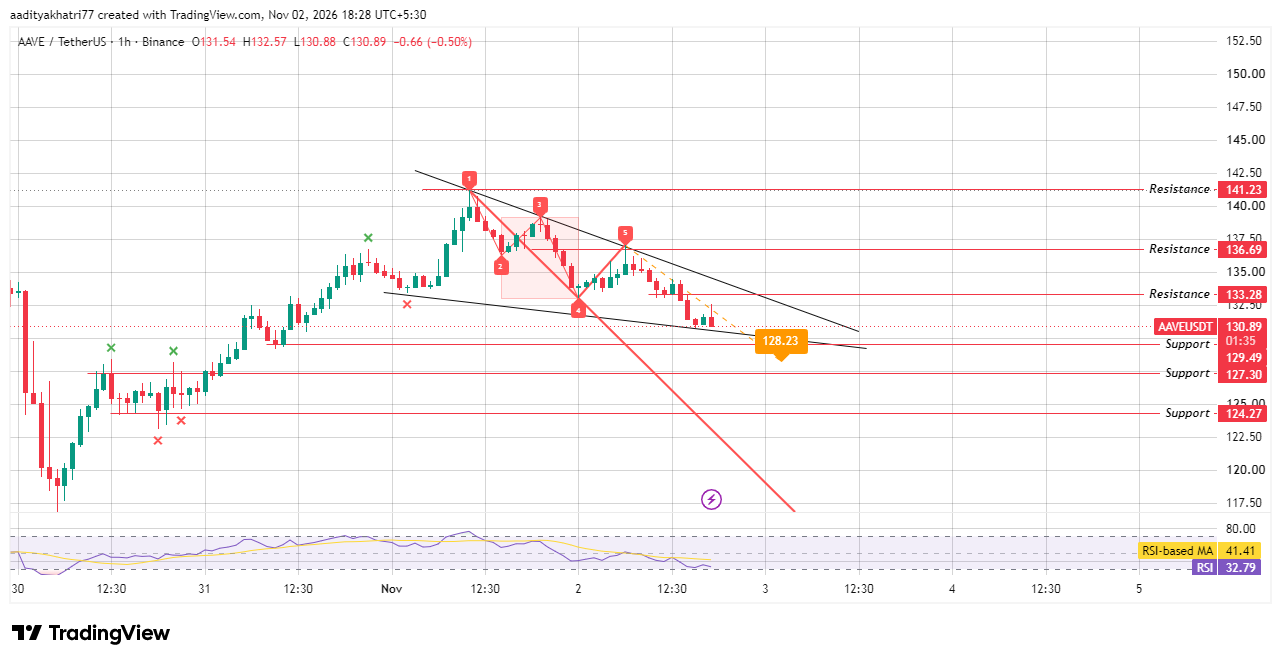
Source: TradingView, AAVE/USDT 1H, Binance, as of November 2, 2026.
The upper trendline now runs near $134.8 and the lower one near $130.5, so price sits right on the lower line. The current price is also close to the bottom of its 24-hour range.
The chart marks a Wolfe wave as well. Its five points run from the $141.23 high down to the latest pullback, and the pattern projects a target near $128.23.
A Wolfe wave is a subjective pattern, so traders treat that target as a guide and not a promise.
The current candle opened at $131.54, ranged from $130.88 to $132.57 and trades near $130.89, a decline of 0.50%.
The RSI reads 32.79 against its average of 41.41, which shows weak momentum just above the 30 oversold line.
Can AAVE Bounce and Break the Falling Wedge?
The bullish case starts with a bounce. AAVE needs to hold the lower wedge line and $129.49, since both sit just beneath current price.
The next step is an hourly close above $133.28 with volume over the 20-period average.
After that, price must close above the upper wedge trendline, near $134.8. A falling wedge often resolves upward, yet it can also fail, so confirmation matters.
A confirmed break would open $136.69 first and then $141.23, the November 1 high. The second level may draw sellers, since the last rally stopped there.
What Happens If AAVE Loses $129.49?
The bearish case begins with a rejection below $133.28 or a slide through the lower wedge line. An hourly close under $129.49 on selling volume above the 20-period average would break the wedge to the downside.
That move would also fit the Wolfe wave, which points to $128.23. The next supports are $127.30 and $124.27.
A brief wick under support is not enough. If price closes back above $129.49 within a few hours, the move may prove a false break.
Price Levels to Watch
Support
Resistance
$129.49
$133.28
$127.30
$136.69
$124.27
$141.23
Bull, Base, and Bear Scenarios for Aave Price Prediction
Scenario
Setup
Level
Bull
$AAVE bounces off the lower wedge line, then an hourly candle finishes above $133.28 and the upper wedge line with volume over the 20-period average.
$136.69 first, then $141.23.
Base
$AAVE keeps squeezing inside the wedge, with no hourly close beyond $129.49 or $133.28.
Between $129.49 and $133.28.
Bear
The wedge gives way and an hourly candle settles under $129.49 while selling volume tops the 20-period average.
$128.23 first, then $127.30 and $124.2.
Aave vs Bitcoin
Any Aave price prediction 2026 should check how AAVE trades against Bitcoin and Ether.
Over the last 24 hours, AAVE is down 4.4% in dollars, down 4.2% against Bitcoin and down 5.4% against Ether. Those figures imply that Bitcoin lost about 0.2% and Ether gained about 1.1% in dollar terms.
AAVE therefore fell far more than both. The weakness is specific to the token and not market-wide.
Methodology
This Aave price prediction outlook draws on two inputs. Market data comes from CoinGecko and was taken on November 2, 2026.
The chart is an hourly AAVE/USDT view from Binance in TradingView, with timestamps in UTC+5:30.
Support and resistance levels were read directly from the chart. The wedge trendlines carry no labels, so the $134.8 and $130.5 readings are approximate.
The Wolfe wave target of $128.23 comes from the pattern drawn on the chart.
No news item was reviewed, since none was supplied. Trading volume, liquidation data and exchange flows were not part of this review, and the scenarios carry no assigned probabilities. Hourly levels apply to the next day or two, not to weeks.
Expert Opinion
As general market commentary, a falling wedge often leans bullish, while a Wolfe wave target can point the other way. When two signals conflict, the first hourly close outside the wedge usually carries the most weight.
The $129.49 level matters most here, since it sits next to the lower wedge line. A close below it on rising volume would favor sellers. A close above $133.28 would show that buyers are returning.
Disclaimer: This article is for information only and is not financial advice. AAVE is volatile, and price can fall below $124.27 if support fails and broader market conditions weaken. Hourly breakouts reverse often. No scenario here carries a stated probability, and a confirmed breakout can still fail. Readers should do their own research and size any position to a loss they can accept.