

AKT Price Analysis: Flag Breakout Run Targets $5.93
 BASED
BASED
 BULLISH
 AKT
AKT
 READ
READ
Akash Network is one of many top performers amid the broader market recovery. Crossing above the $4 barrier, the bullish trend aims to prolong the parabolic rally.
Will the new breakout rally reach the $5.93 target this December? Let's find out in Coinpedia’s latest AKT price analysis.
Akash Network (AKT) Price Performance
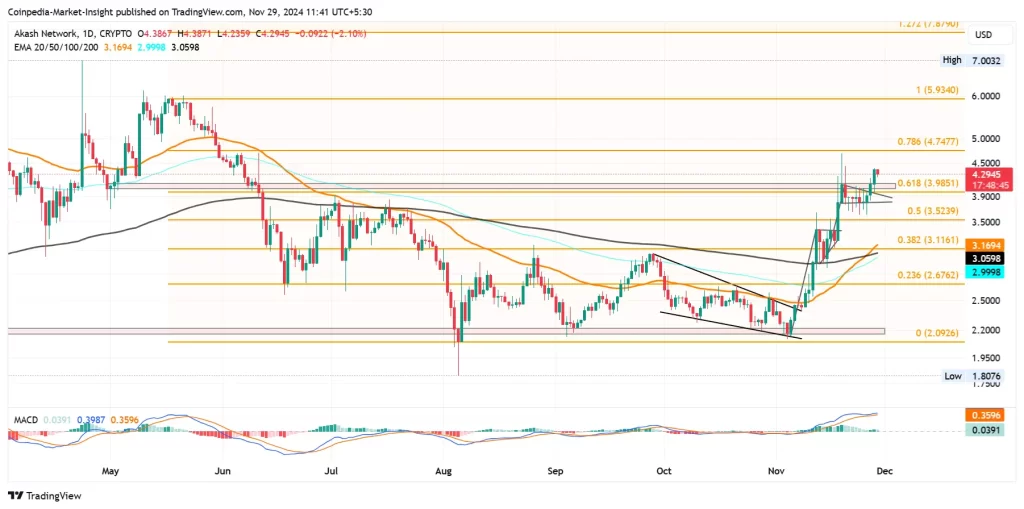
In the daily chart, the AKT price action shows a second flag pattern, gaining momentum. With three consecutive bullish candles, the AKT price has surged from $3.61 to a peak of $4.38.

The triple white soldiers' pattern accounts for a price jump of nearly 22%. Furthermore, it surpasses the long-standing resistance zone, extending from $4 to $4.12.
The intraday pullback of 2.59% comes as a potential retest of the bullish breakout. As the recovery rally has surpassed the 67.80% Fibonacci level, the uptrend continuation is more likely.
Technical Indicators:
Following the golden crossover, the 100-day and 200-day EMA are closing the gap for a new bullish crossover. Furthermore, the MACD and signal line maintain a positive alignment by avoiding a negative crossover possibility. Hence, the technical indicators are siding with the bullish team.
Will Akash Network Price Cross $5?
Based on the Fibonacci retracement tool, the upside price targets beyond the immediate $4.74 resistance level are $5.93 and $7.87. On the flip side, the crucial support remains at the $4 mark, followed by the $3.52.
Will Akash Network reach the $10 price target? Read our Akash Network (AKT) Price Prediction to find out!
FAQs
A triple white soldiers pattern and a bullish breakout from the $4-$4.12 resistance zone.
Support is at $4 and $3.52; resistance is at $4.74, and higher targets are at $5.93 and $7.87.
Yes, indicators like the golden EMA crossover and MACD alignment support the uptrend.

