ARB has taken a beating this cycle, and everyone watching it knows that. But the Arbitrum price prediction conversation is shifting a bit this week, because price is finally showing some life
ARB has taken a beating this cycle, and everyone watching it knows that.
But the Arbitrum price prediction conversation is shifting a bit this week, because price is finally showing some life after months of getting dragged lower.
The charts are lining up at a spot that could either turn into a real reversal or just another failed bounce.
A Quick Look Back at Arbitrum
Arbitrum is one of the biggest names in the Ethereum Layer 2world, built to make transactions faster and cheaper without giving up on Ethereum's security.
It's got real usage behind it: DeFi protocols, bridges, and a decent chunk of on-chain activity still route through Arbitrum.
That said ARB, the token, has had a rough run, sliding hard from its highs along with most of the broader altcoin market.
The gap between the network's actual usage and the token's price has been a common complaint from holders for a while now.
Where ARB Sits Right Now
As per Coinstats' live data ,ARB is trading around $0.0884 at the moment, down slightly on the day after tapping a high of $0.0914 and a low of $0.0875.
Nothing dramatic, but the coin is sitting right at a zone that matters: a support-turned-resistance zone that's been fought over recently, and the base of a tightening pattern on the shorter timeframe too.
Liquidation Data Shows Longs Getting Squeezed
According to Coinglassliquidation data , ARB shows a familiar pattern for ARB lately: longs have been taking most of the pain.
Over the past 24 hours, ARB saw $402.96K in total liquidations, with $304.05K of that coming from long positions and $98.92K from shorts.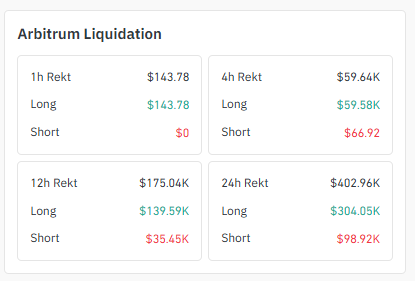
Zoom into the shorter windows and it's more of the same. In the last hour, $143.78 got liquidated, and every bit of it was long, with $0 on the short side.
Over 4 hours, $59.64K total, with $59.58K from longs.
And over 12 hours, $175.04K total, with $139.59K coming from longs. Traders trying to call the bottom early keep getting stopped out, which is common right before a real base actually forms.
Exchange Volume Heatmap Shows Where the Action Is
Binance dominates ARB futures trading volume with $41.23M, well ahead of the rest of the field.
Bybit sits next at $19.48M, followed by MEXC ($17.30M), BingX ($15.68M), and OKX ($15.13M) all in a fairly tight cluster. 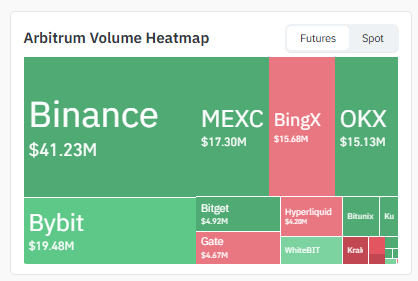
Bitget ($4.92M), Gate ($4.67M), and Hyperliquid ($4.20M) make up the next tier, with smaller amounts spread across Bitunix, WhiteBIT, Kraken, and KuCoin.
The concentration on Binance means moves there tend to set the tone for the rest of the market.
But the fact that six or seven exchanges are all carrying meaningful volume is a decent sign; it means there's real interest in ARB right now, not just activity on one venue.
4-Hour Chart: A Triangle Right at the Decision Point
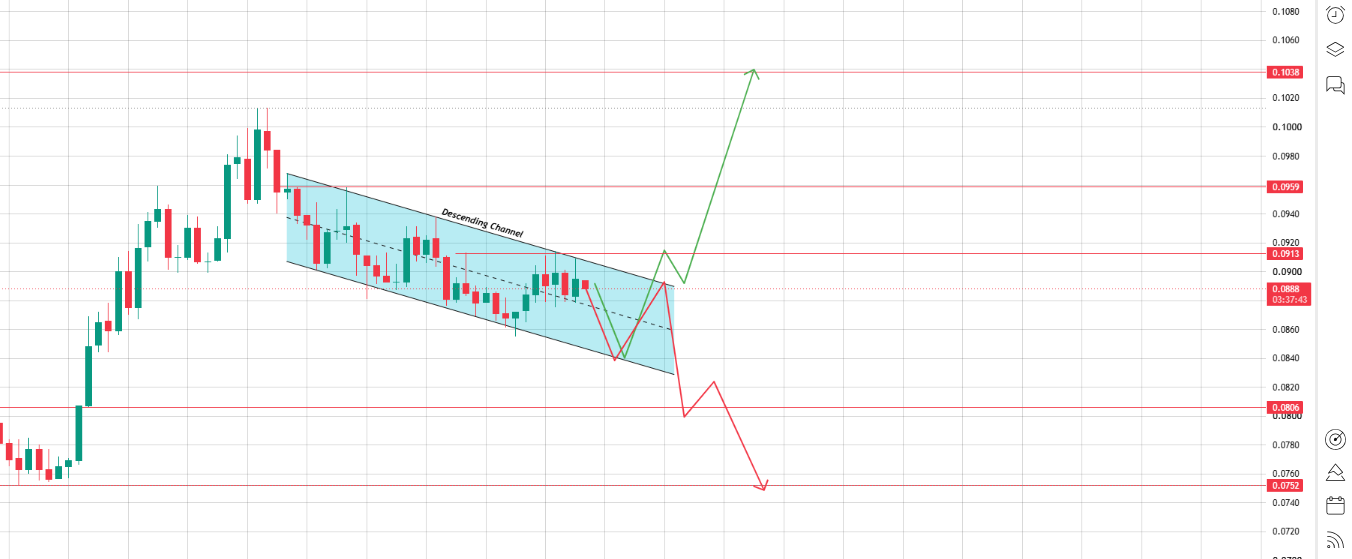
Zooming into the 4-hour chart, ARB has been squeezing inside a descending channel, with the price compressing between converging trendlines and currently sitting close to $0.0888, right near the apex.
A breakout above the triangle, confirmed with a close over $0.0913, would open the path toward $0.0959 to $0.1038, matching up nicely with the daily resistance target.
Source:Chart Taken From TradingVIew
That kind of alignment between timeframes tends to carry more weight than a random level.
If the triangle breaks down instead, the first support to watch is $0.0806. Lose that, and the price could slide toward $0.0752, right around the same zone as the daily double bottom.
Basically, both timeframes are pointing at the same two outcomes: a coordinated bounce or a coordinated slide.
Short-Term Support & Resistance (4H)LevelPriceImportanceResistance 1$0.0959Triangle breakout resistanceResistance 2$0.1038Extended bullish targetSupport 1$0.0806Immediate intraday supportSupport 2$0.0752Bearish breakdown target
Daily Chart: Basing Off a Major Double Bottom
Looking at the daily chart, ARB carved out what looks like a double bottom down near $0.0734, after a long slide from much higher levels.
Since then, the price has been climbing back, pushing through a chunk of that lost ground and now sitting just under a key zone between $0.0863 and $0.0884, a level that's flipped between support and resistance a few times already.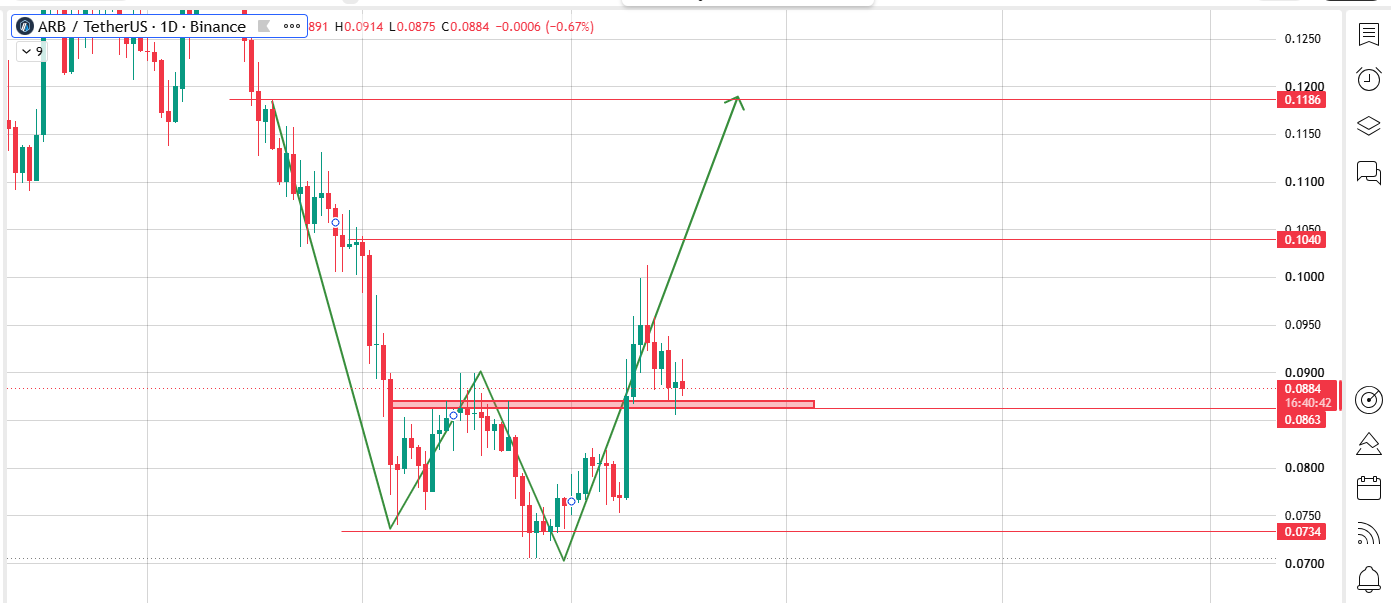
Source: Chart Taken From TradingVIew
If ARB can push through this zone and keep climbing, the first real target up top is $0.1040, a level that's acted as resistance before.
Clear that with conviction, and the bigger target becomes $0.1186, which would mark a serious recovery from where price has been trading.
On the downside, if this bounce fails and ARB slips back under $0.0863, the double bottom zone near $0.0734 becomes the level that needs to hold.
Losing that would be a bad sign for the broader recovery attempt.
Long-Term Support & Resistance (Daily)LevelPriceImportanceMajor Resistance 1$0.1040Key resistance from prior structureMajor Resistance 2$0.1186Major bullish recovery targetMajor Support 1$0.0863Immediate support/resistance boxMajor Support 2$0.0734Double bottom, major support
Social Sentiment: Traders Betting on a Multi-X Bounce
There's a bullish undertone building in ARB's corner of crypto Twitter.
Trader Altcoin Sherpa recently pointed to ARB alongside coins like NEAR and FARTCOIN as examples of altcoins that got "totally decimated" during the downturn, arguing it wouldn't take much for names like these to move a few multiples higher once the broader market turns. 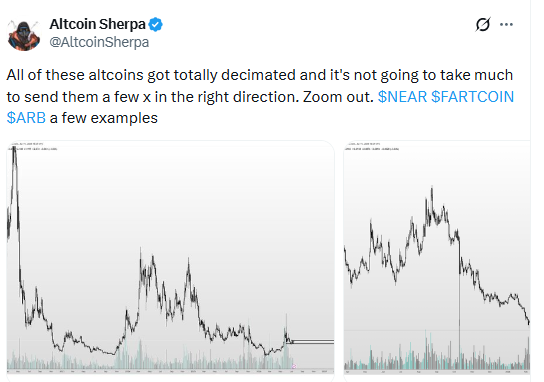
His point was simple: zoom out, and the amount of damage already priced into these charts means the risk-reward for a bounce looks a lot better than it did a few months back.
That kind of sentiment doesn't guarantee anything on its own, but it lines up with what the charts are showing: a coin that's fallen a long way, found some kind of floor, and is now testing whether it can actually turn things around.
ARB Price Scenarios: Bullish, Neutral, BearishScenarioTriggerPrice TargetsBullish BreakoutDaily reclaim of $0.0884 zone or 4H close above $0.0959.$0.1038 → $0.1186Neutral / Range-BoundPrice stays trapped between $0.0806 and $0.0884 while the triangle apex holds.Continued chop near current levelsBearish BreakdownDaily loss of $0.0863 or 4H loses $0.0806 support.$0.0752 → $0.0734
Final Outlook: ARB Needs Bitcoin and Ethereum on Its Side
Arbitrum is an Ethereum-linked token first and foremost, so ETH's price action matters more here than for most altcoins.
If Ethereum holds its ground and Bitcoin stays supportive, that's the kind of backdrop that could help ARB clear both the daily resistance zone and the 4H triangle, opening the door toward $0.10 and eventually $0.1186. But if the majors weaken,
ARB's recovery attempt is likely to stall out, sending price back to retest the $0.0806–$0.0734 zone.
Right now, ARB is genuinely at a fork in the road.
After months of straight-down price action, this is the first setup that gives bulls something real to work with, but it still has to prove itself at these levels before anyone calls it a trend reversal.
Disclaimer: ARB price scenarios are based on technical analysis and market conditions. Crypto assets are volatile, and historical patterns do not guarantee future results.