

Arbitrum’s 91% Rally Targets $1: Next Stop at $1.86?
 BULLISH
 RLY
RLY
 ARB
ARB
 RALLY
RALLY
 READ
READ
The ARB price trend maintains a bullish approach with the Bitcoin price dropping below the $95,000 mark. With a 26% surge over the last 7 days, the ARB has a market cap of $3.864 billion.
With the ongoing rally unaffected by the broader market pullback, the upside potential for ARB is growing. Will this growing rally result in a massive 2x rally in December? Let's find out.
Arbitrum (ARB) Price Performance
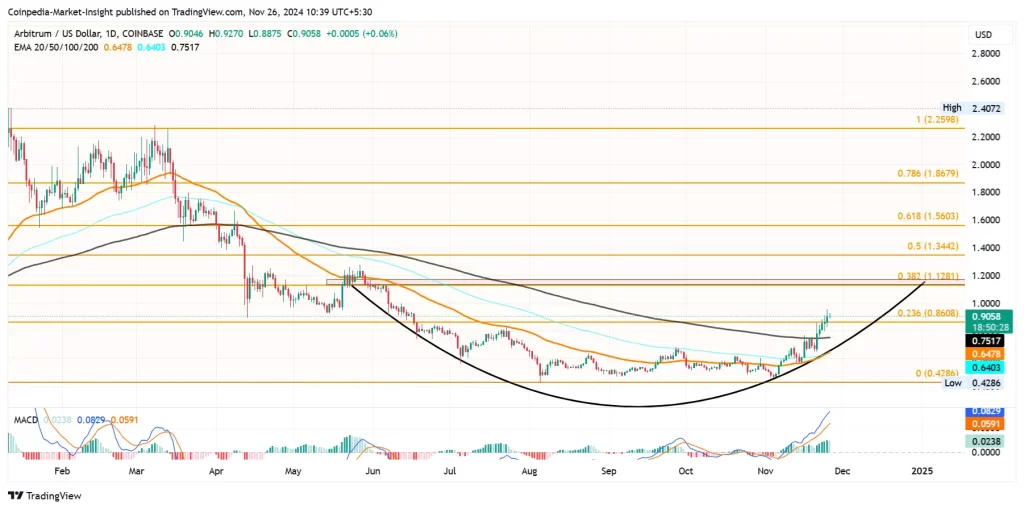
In the daily chart, the ARB price action shows the Rounding Bottom reversal rally gaining momentum. The decline of the Rounding Bottom pattern coincides with the 38.20% Fibonacci level at $1.12.

Over the past 5 days, the ARB price action has made consecutive bullish candles, accounting for a price jump of 34%. The bull run has exceeded the 200-day EMA and the 23.60% Fibonacci level at $0.86.
Currently, the ARB price is trading at $0.899, with an intraday move of minus 0.70%. This teases a potential retest of the 23.60% level for a bullish recovery. The Rounding Bottom reversal started with a bullish engulfing candle on November 5th and has resulted in a 91% surge until now.
Technical Indicators:
EMA: The rising ARB price has spiked the 50-day and 100-day EMA lines, resulting in a bullish crossover. Further, the 50D and 200D EMA golden crossover chances have significantly increased.
MACD: The bullish trend has prolonged the MACD and Signal Line rally with gradually increasing bullish histograms.
Will Arbitrum Price Hit $250?
The ongoing rally aims to challenge the neckline with the $1 psychological marker resistance on the horizon. In case of a bullish breakout, the uptrend is likely to reach the 78.60% Fibonacci level at $1.8679.
Conversely, the crucial support below the 23.60% Fibonacci level is present at the 200-day EMA at $0.75 and the 50-day EMA at $0.6476.
Curious about Arbitrum’s future? Read our Arbitrum (ARB) Price Prediction for an overview of long-term targets!
FAQs
The bullish trend is driven by the Rounding Bottom reversal pattern, a 91% surge since early November, and bullish crossovers in key moving averages like the 50-day and 100-day EMAs.
The immediate resistance lies at the $1 psychological level, followed by the 78.60% Fibonacci level at $1.8679.
A breakdown below the 23.60% Fibonacci level at $0.86, with further declines toward the 200-day EMA at $0.75, could invalidate the bullish momentum.

