Key Highlights Bitcoin is trading at $74,283 (-0.42% 24h) with a $1.49T market cap as the 200-day SMA holds as support An analyst draws a direct structural parallel between Bitcoin's 2023 pre
Key Highlights
Bitcoin is trading at $74,283 (-0.42% 24h) with a $1.49T market cap as the 200-day SMA holds as support
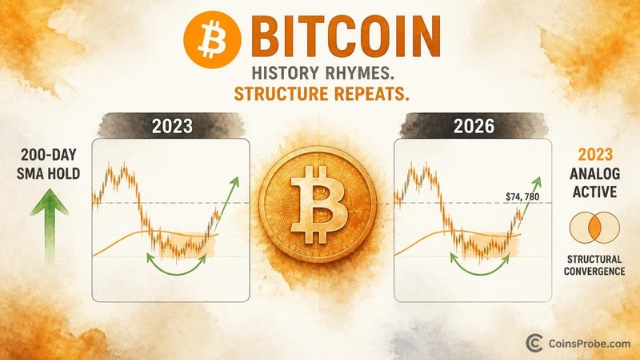
An analyst draws a direct structural parallel between Bitcoin's 2023 pre-rally consolidation and the current 2026 setup — both show a trough, recovery, and pullback to a moving average crossover zone
The chart marks $74,780 as the current structural coordinate; a close above the gray moving average is the confirmation the analog requires
Bitcoin is trading at approximately $74,283 — down 0.42% over the past 24 hours — with a market cap of $1.49 trillion. The number that matters most right now is not the daily candlestick. It is the 200-day simple moving average, which held as support during the recent pullback and is now serving as the structural foundation for what one analyst argues is a replay of one of Bitcoin’s most decisive recoveries on record.
An analyst who goes by the handle @alicharts published a side-by-side chart on November 10, 2026 overlaying Bitcoin’s 2023 price action against its current 2026 trajectory. The post accompanied an earlier call: “LAST CHANCE TO BUY THE BITCOIN DIP? It was the 200-day SMA. $BTC held it. Now the rebound begins.” The comparison is not casual pattern-matching. It maps a specific structural setup — a deep trough, a recovery, a pullback to a moving average crossover zone — that preceded one of the strongest sustained rallies in Bitcoin’s history.
The 200-day simple moving average is the single most watched long-term trend indicator in both traditional and crypto markets. It averages Bitcoin’s closing price across the prior 200 trading days, smoothing out short-term volatility to reveal the underlying directional bias. When price trades above it, the long-term trend is structurally bullish. When price falls to it and holds, that test becomes a defining inflection point — historically separating corrections from bear markets.
Bitcoin’s current price of $74,283 represents exactly that inflection. The recent pullback brought price into contact with the 200-day SMA, and — per the analyst’s read — it held. That hold is the entire thesis. For context on why key moving average levels matter at this juncture, see our earlier analysis on how low BTC, ETH, and XRP can go and the precise EMA200 test that played out at $77,676.
The chart draws a direct structural parallel between February–April 2023 and the current July–November 2026 period. In 2023, Bitcoin carved a deep trough near $15,000–$18,000, staged a recovery rally into the $21,800–$27,800 range, then pulled back into a moving average crossover zone before an upward arrow marked the launch of a sustained advance that eventually reached $30,000 and beyond on that leg alone.
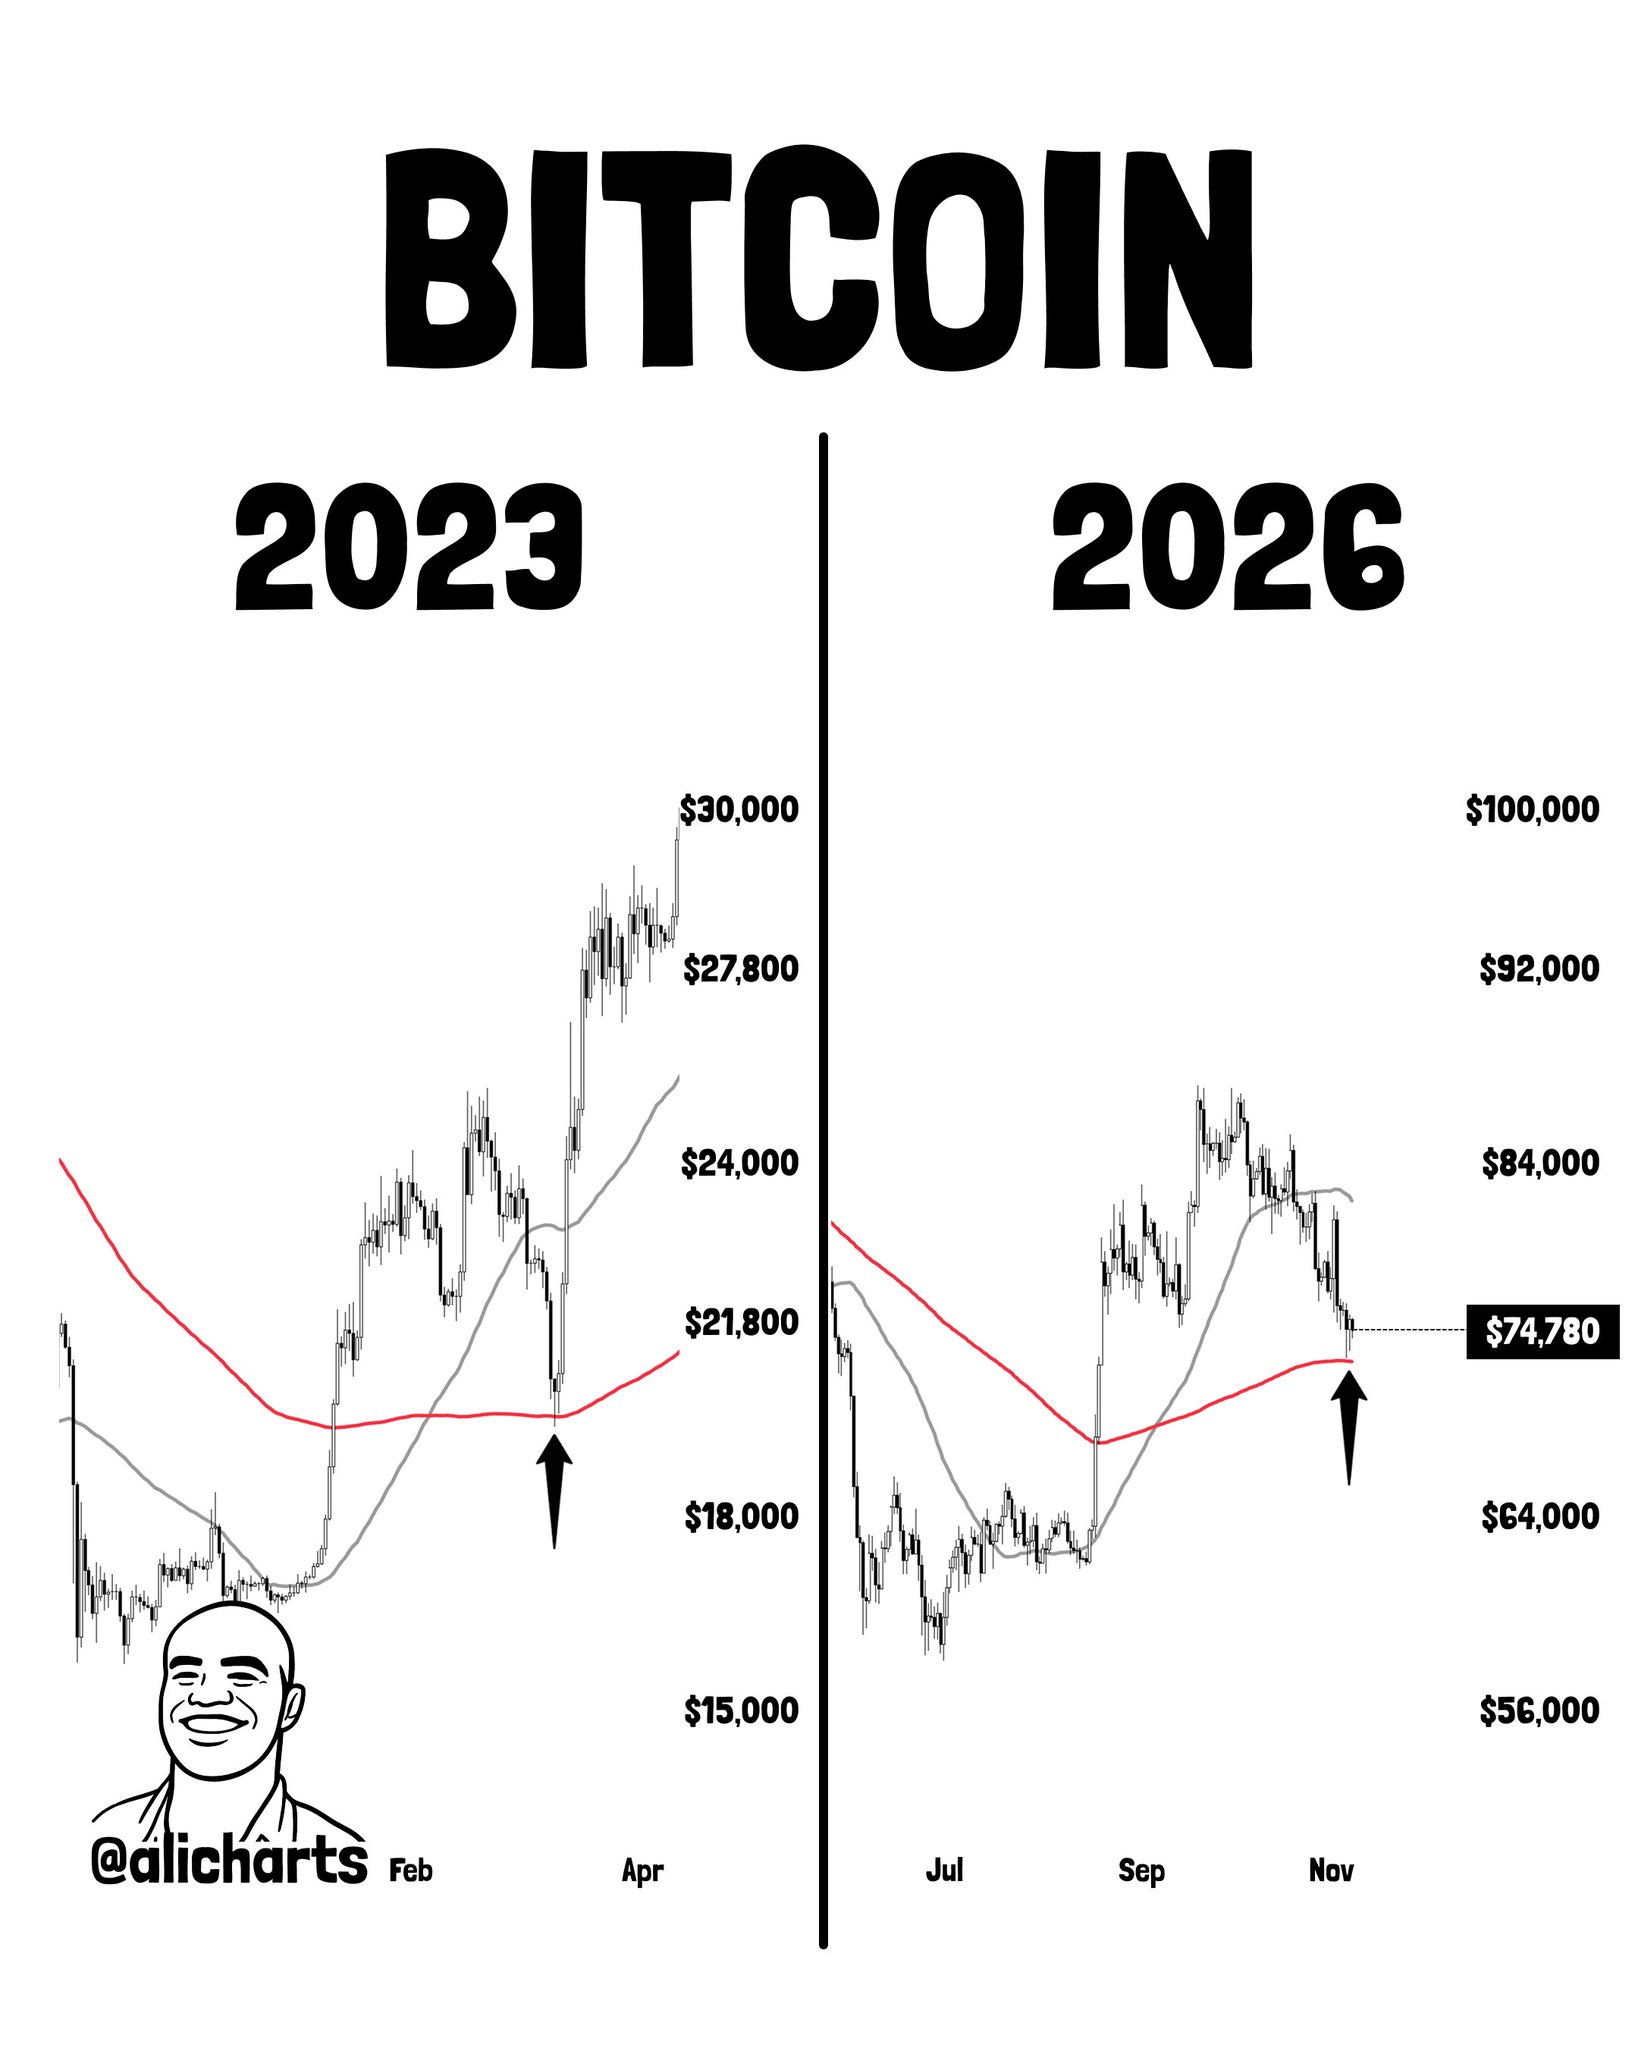
Bitcoin 2023 vs 2026 Comparison | Source: @alicharts (X)
The right panel of the chart shows the 2026 analog unfolding in a structurally identical sequence. Bitcoin printed a trough, rallied toward the $84,000–$92,000 range, and has since pulled back. The current price of $74,783 — marked explicitly with a dotted horizontal line on the chart — sits at the precise equivalent of the 2023 consolidation zone: below the gray moving average, at or just above the red moving average. The analyst’s arrow in 2023 pointed up from this exact structural position. The 2026 panel places the current moment at the same point in the sequence.
This is a pattern-still-forming setup. There is no confirmed breakout above resistance on the 2026 panel. The analog says the launch point is here — it does not guarantee the launch has begun.
The 2023 comparison carries a specific and limited claim. It says the structure of the current correction — the shape of the trough, the character of the recovery, the depth of the pullback to the moving average — matches the 2023 pre-rally setup with notable precision. That structural similarity is a probabilistic input, not a deterministic outcome.
What it says: Bitcoin is currently at the structural equivalent of the 2023 consolidation zone, where holding the moving average crossover area preceded a significant recovery rally.
What it doesn’t say: The magnitude or timing of any 2026 move is confirmed. The 2023 analog provides a directional bias and a structural reference, not a price target or a guaranteed sequence.
What to watch for continuation: A sustained close above the gray moving average on the right panel — which the chart shows price currently trading below — would shift the 2026 structure from consolidation to breakout, completing the analog’s bullish sequence. An analyst had previously identified $73,000 as the next dip-buy zone — the current $74,283 print sits just above that level, adding another layer of confluence to the 200-day SMA hold thesis.
The chart explicitly marks $74,780 as the current price reference — the dotted line that anchors the 2026 panel to the 2023 analog’s inflection zone. This is not a support level in the traditional sense; it is a structural coordinate. The analyst’s thesis says that being at this coordinate, with the 200-day SMA holding, is the setup. The invalidation is not a number the analyst stated — it is the loss of the moving average hold itself. If the 200-day SMA fails to hold as support and price closes decisively below it, the structural parallel to 2023 collapses, and the analog’s bullish implication no longer applies.
Bitcoin at $74,283 is at a moment the analyst frames as structurally equivalent to one of the best buying opportunities of the prior cycle. The 200-day SMA held. The pattern matches. Whether the arrow that pointed up in 2023 from this same structural position does the same in 2026 depends entirely on whether the moving average hold is genuine or a temporary pause before further downside. The gray moving average on the chart is the line that answers that question. Watch $74,780 — reclaiming and sustaining above it, with a close above the gray moving average, is the confirmation the analog requires.
Disclaimer: The views and analysis presented in this article are for informational purposes only and reflect the author’s perspective, not financial advice. Technical patterns and indicators discussed are subject to market volatility and may or may not yield the anticipated results. Investors are advised to exercise caution, conduct independent research, and make decisions aligned with their individual risk tolerance.
Also Read: 6 Signals to Time the AI Bubble Bursting — A Framework