Bitcoin Cash just staged one of its sharpest recoveries of the year, climbing back from lows near $200 to trade above the $238 level. The move comes after BCH spent the first half of 2026 sli
Bitcoin Cash just staged one of its sharpest recoveries of the year, climbing back from lows near $200 to trade above the $238 level.
The move comes after BCH spent the first half of 2026 sliding lower, at one point down close to 60% for the year.
$Bitcoin Cash is a 2017 fork of $BTC built around bigger blocks and cheaper on-chain transactions, and this Bitcoin Cash price prediction looks at whether the current breakout has legs or whether $270 is still a stretch.
The daily chart shows a real structural shift, but the short-term picture just cooled off after a trendline break, so timing matters here.
Bitcoin Cash Price Prediction: Market Overview
Metric
Value
7 Day Change
+0.7%
24h Range
$234.94 - $247.26
Market Cap
$4.78B
FDV
$4.78B
24h Volume
$100.032M
Circulating Supply
20.061M
Total / Max Supply
20.061M / 21M
Source:Data from CoinGecko
Why is $Bitcoin Cash breaking out? Will it sustain?
This one is not a random pump. BCH recently cleared a short-term falling channel after repeatedly defending the $238-$240 zone, and that breakout confirmed buyers had taken back control.
Futures open interest climbed above $382 million during the move, which points to fresh money coming in rather than just short covering.
Two things are driving this. First, the broader crypto market is in a BTC-led altcoin rally, and BCH has outperformed both Bitcoin and Ethereum during recent sessions.
Second, the Layla network upgrade that activated on May 15, 2026, added smart contract capability and quantum resistance to the network, giving BCH a fresh narrative beyond just being a payments coin.
$BTC Price Prediction: Short-Term Chart Analysis (1hr)
BCH had been climbing along a clean ascending trendline, but that trendline just broke to the downside, and the price pulled back into consolidation near $238.3.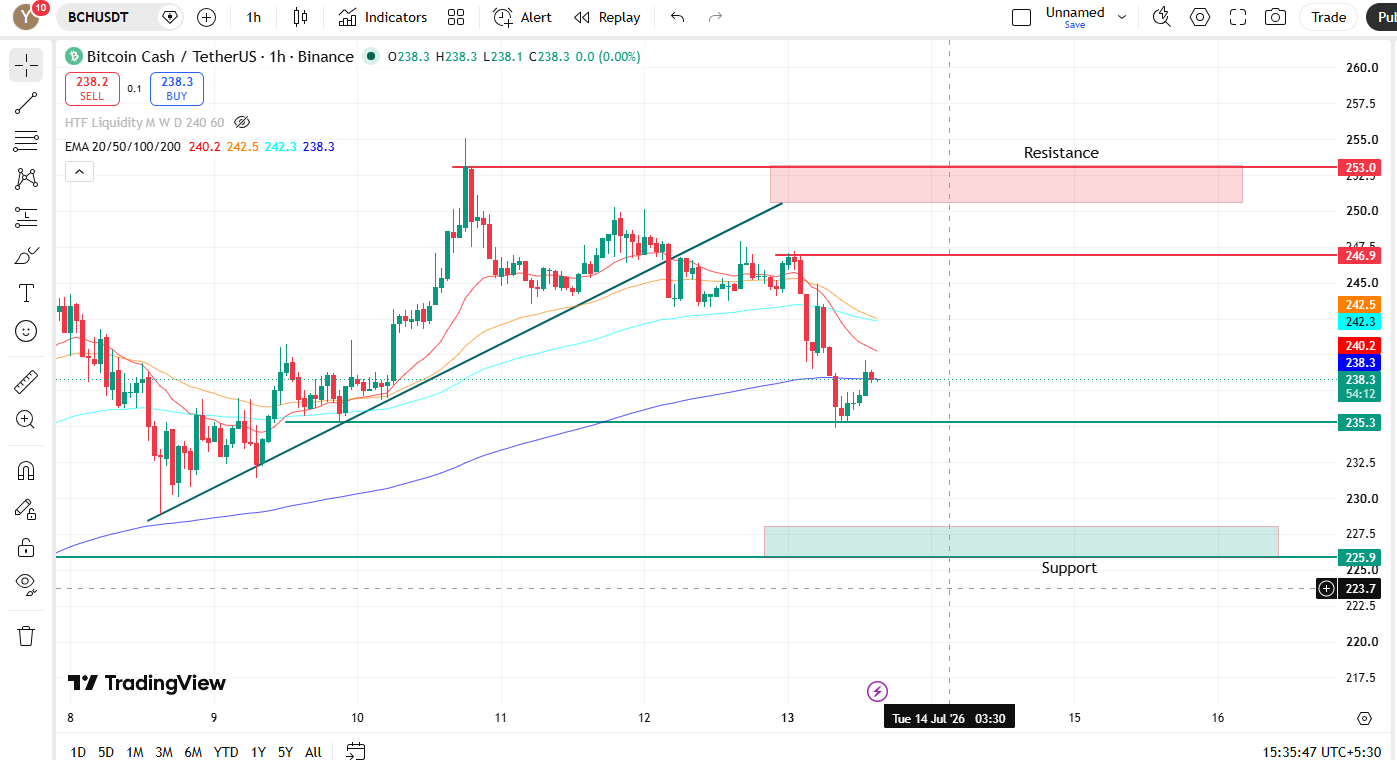
On the EMA front, the 20 $EMA sits at $240.2, the 50 $EMA at $242.5, the 100 $EMA at $242, and the 200 $EMA at $238.3.
The price is currently below the 20 and 50 EMA but still holding right above the 200 $EMA, which keeps the short-term structure intact for now even after the trendline break.
Resistance
$246.9
Resistance
$253.0
Support
$235.3
Deeper Support
$225.9
As long as BCH holds above $235.30, the pullback looks like a pause, not a reversal.
Bitcoin Cash Price Prediction: Long-Term Chart Analysis (Daily)
The daily Bitcoin Cash chart tells a bigger story. 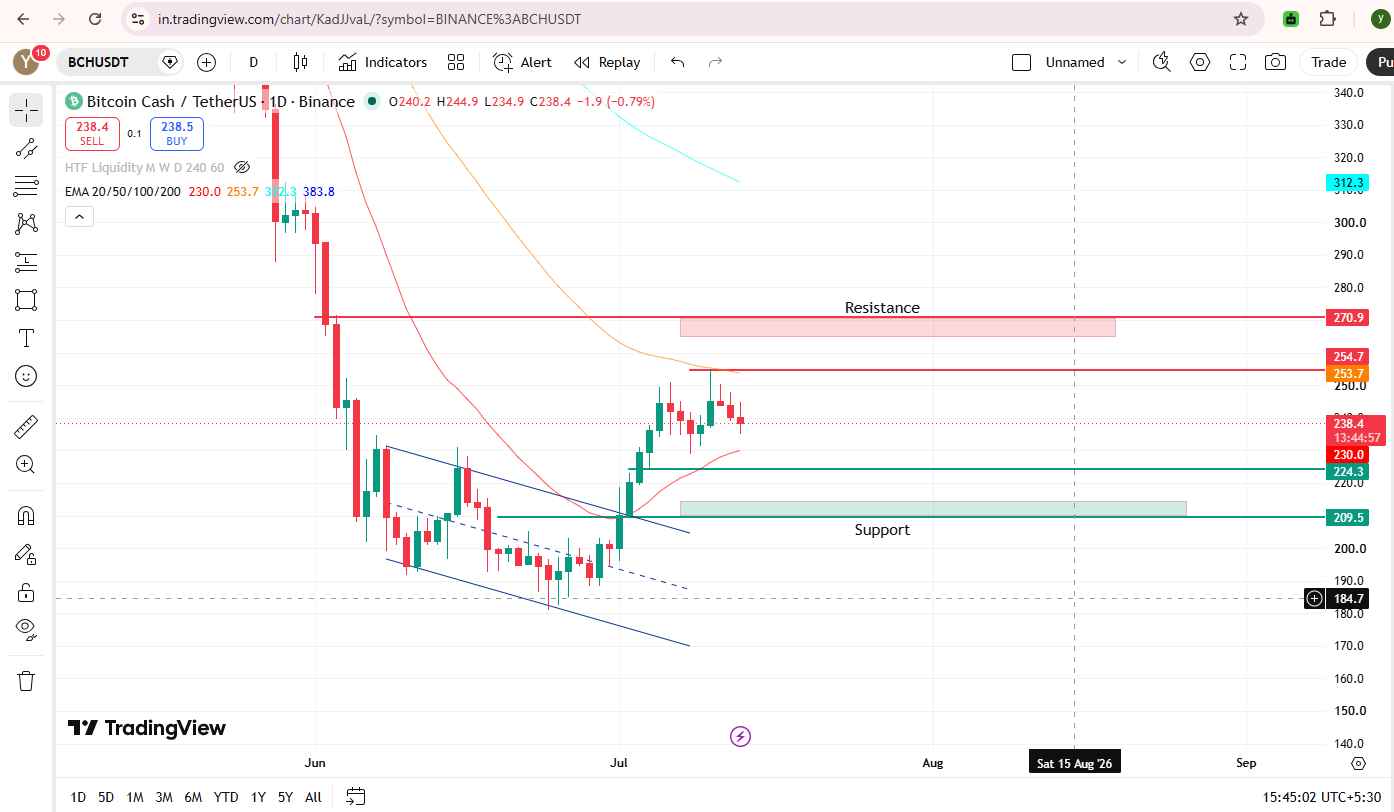
BCH spent most of the month inside a falling channel, bottomed near $180-$200, then broke out of that channel in early July and reclaimed ground fast.
On the daily EMA setup, the 20 EMA is at $230.0, the 50 EMA at $253.7, the 100 EMA at $312.3, and the 200 EMA at $383.8.
Price is now above the 20 EMA but still well below the 50, 100, and 200 EMAs, which means the long-term trend is technically still bearish even though short-term momentum has clearly turned.
Level
Price
Resistance
$254.7 - $270.9
Support
$209.5 - $224.3
Bitcoin Cash Price Prediction: Expert View
As per the market analysis, short-term momentum is bullish, but the daily trend is still bearish below it.
A hold above $235.3 keeps the breakout alive, and buyers have defended that zone well so far.
A daily close above $254.7 would be the real confirmation that $270 is realistic, since that is where the bigger EMAs still sit overhead.
On the flip side, losing $225.9 would signal this recovery is fading and open the door back toward deeper support near $209.5.
Disclaimer
This article is for informational purposes only and is not financial advice. Cryptocurrency markets are highly volatile; please do your own research before investing.