Bitcoin is trading near $82,634, up 0.4% in the last 24 hours. The move follows four days of selling and a rough start to October. The market cap sits at $1.65 trillion. Traders are asking a
Bitcoin is trading near $82,634, up 0.4% in the last 24 hours. The move follows four days of selling and a rough start to October.
The market cap sits at $1.65 trillion. Traders are asking a simple question: is this a pause or the start of a real recovery?
What Is the BTC Price Today?
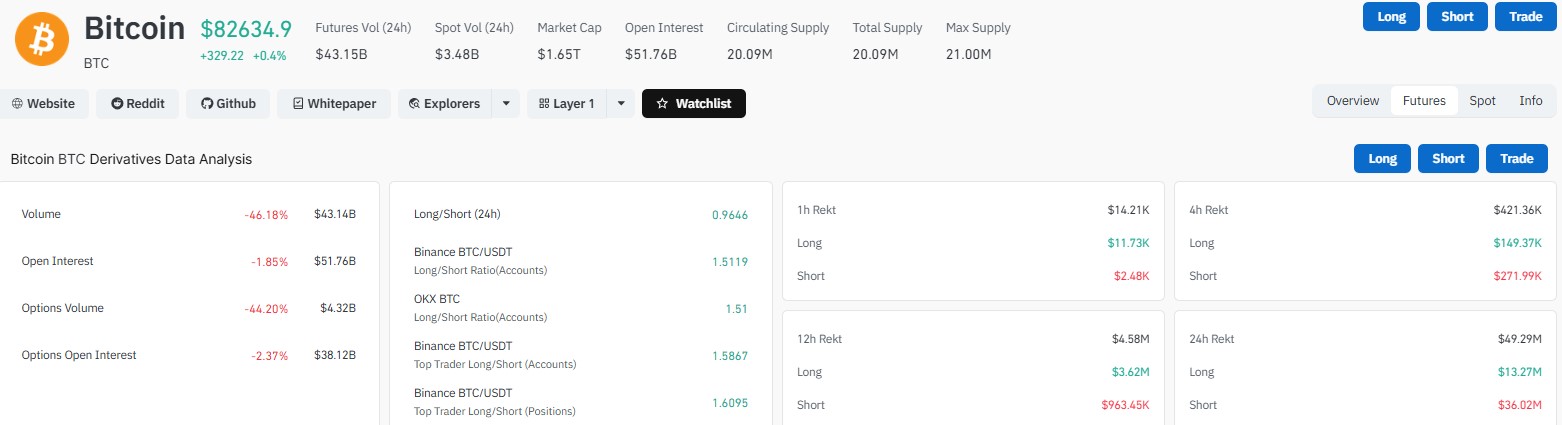
The Bitcoin price today is $82,634.9, up $329.22 on the day. Circulating supply is 20.09 million out of a maximum of 21 million coins.
Futures volume fell 46.18% to $43.15 billion. Options volume dropped 44.20% to $4.32 billion.
Lower volume often means traders are waiting. Open interest is $51.76 billion, down 1.85%. Options open interest is $38.12 billion, down 2.37%.
Why Did BTC Price Fall in October?
The month began with a sharp dump. The price dropped nearly $7,000 in 48 hours. ETH fell 10%, and many altcoins lost 15% to 20%.
About $1 billion in long positions were liquidated. Analyst Ash Crypto points to AI fears, US government coin moves, war headlines, and bad memories of October 10.
The latest bitcoin news today is calmer. Selling has slowed, and buyers are trying to step back in.
Is Another Crypto Crash Coming?
One year ago today, over $19 billion in crypto positions were liquidated in 24 hours. It remains the largest single-day liquidation event on record.
Crypto Rover says it was bigger than LUNA, COVID, and FTX. His chart showed BTC down 12.73%, ETH down 14.39%, and XRP down 53.40% that day.
Today looks calmer. Total liquidations over 24 hours are only $49.29 million. Over the full day, shorts lost more than longs, which is the opposite of a crash.
Time Frame
Total Liquidations
Longs
Shorts
1 hour
$14.21K
$11.73K
$2.48K
4 hours
$421.36K
$149.37K
$271.99K
12 hours
$4.58M
$3.62M
$963.45K
24 hours
$49.29M
$13.27M
$36.02M
Are Investors Selling $BTC at a Loss?
Santiment says the drop looked more like profit-taking than panic. From October 2 to 8, holders realized over $3.3 billion more in profit than in losses.
No day that week closed with a net realized loss. That matches recent profit-taking weeks of about $3.4 billion in late September and $3 billion in late August.
Compare that with August 14 to 20, when net losses were about $1 billion and 6 of 7 days were in the red.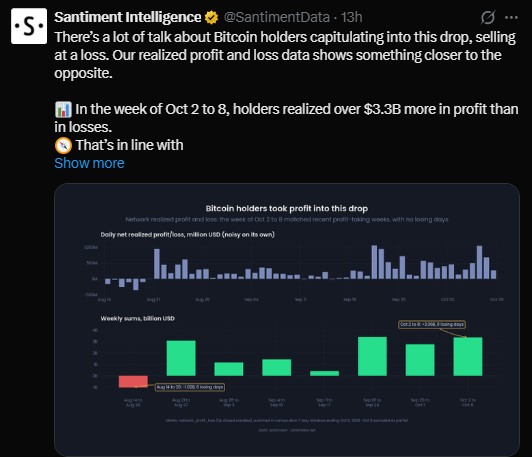
There is one limit. The data covers the whole network, so some recent buyers may still have sold at a loss.
Are BTC ETFs Seeing Inflows or Outflows?
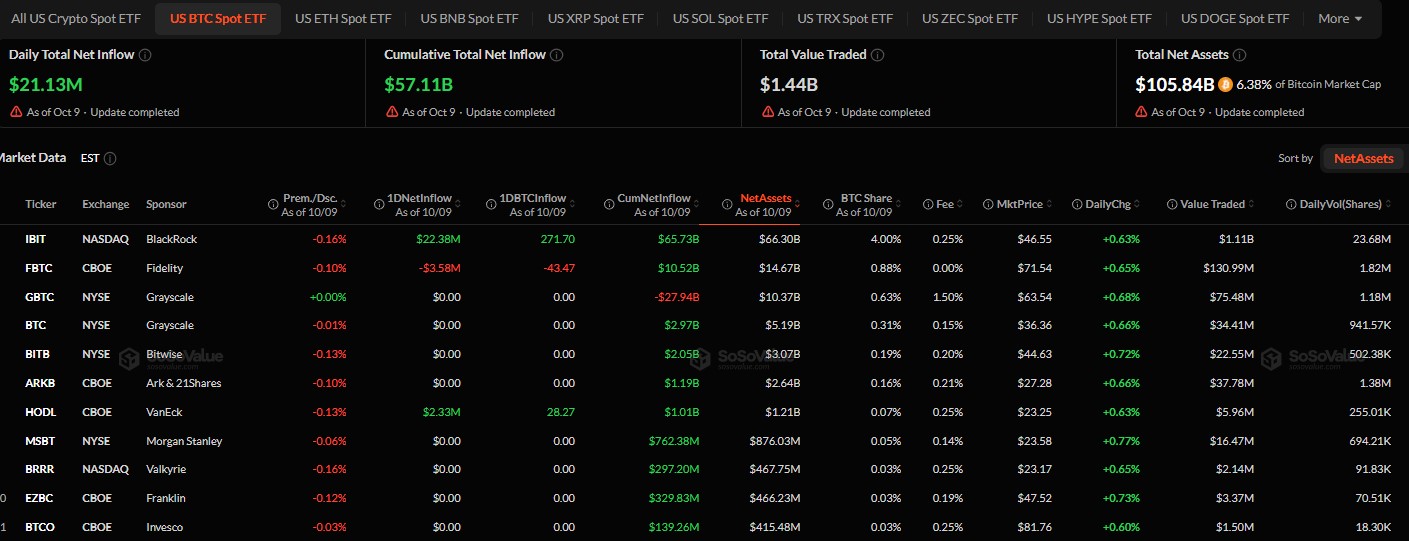
US spot $BTC ETFs took in $21.13 million on October 9. Total inflows since launch are $57.11 billion.
Net assets stand at $105.84 billion, or 6.38% of the market cap.
Fund
Sponsor
Daily Net Inflow
IBIT
BlackRock
+$22.38M
HODL
VanEck
+$2.33M
FBTC
Fidelity
-$3.58M
All US spot BTC ETFs
+$21.13M
Is $BTC Bullish or Bearish Right Now?
The overall long/short ratio is 0.9646, a slight lean to the bearish side. Bigger traders look more confident.
Binance top traders show a position ratio of 1.6095 and an account ratio of 1.5867. Regular account ratios on Binance and OKX are near 1.51.
Will Bitcoin Go Up in October?
Nobody knows. Analysts are split on the next move.
Ali Charts shows two fractal paths. In the bullish one, Bitcoin repeats its 2023 pattern and heads toward $92,000. If the fractal fails, more downside could come first.
He marks $82,470 as a key level.
Ash Crypto expects a short squeeze that lifts BTC above $90,000 by the end of October. He also says ETH could reach $3,000.
He says retail is panic selling, and some bears call for $40,000. He sees that as a setup for a reversal and is very bullish on Q4.
He admits a deeper dip is possible. His line in the sand is the 50-week moving average, now near $77,000.
BTC Price Prediction: Key Support and Resistance Levels
Technical traders point to the Supertrend line near $79,600. BTC bounced from there. If it holds, $84,000 to $86,000 is the next zone.
A break below could send the price toward $78,000.
Price Level
What It Means
$92,000
Ali Charts bullish fractal target
$90,000
Ash Crypto short squeeze target
$84,000 to $86,000
Next zone if support holds
$82,470
Key level on the fractal chart
$79,600
Supertrend support
$78,000
Next drop level if support fails
$77,000
50-week moving average
Most Bitcoin price forecast views rest on these same levels. BTC has not broken its bigger trend yet, but volume is weak.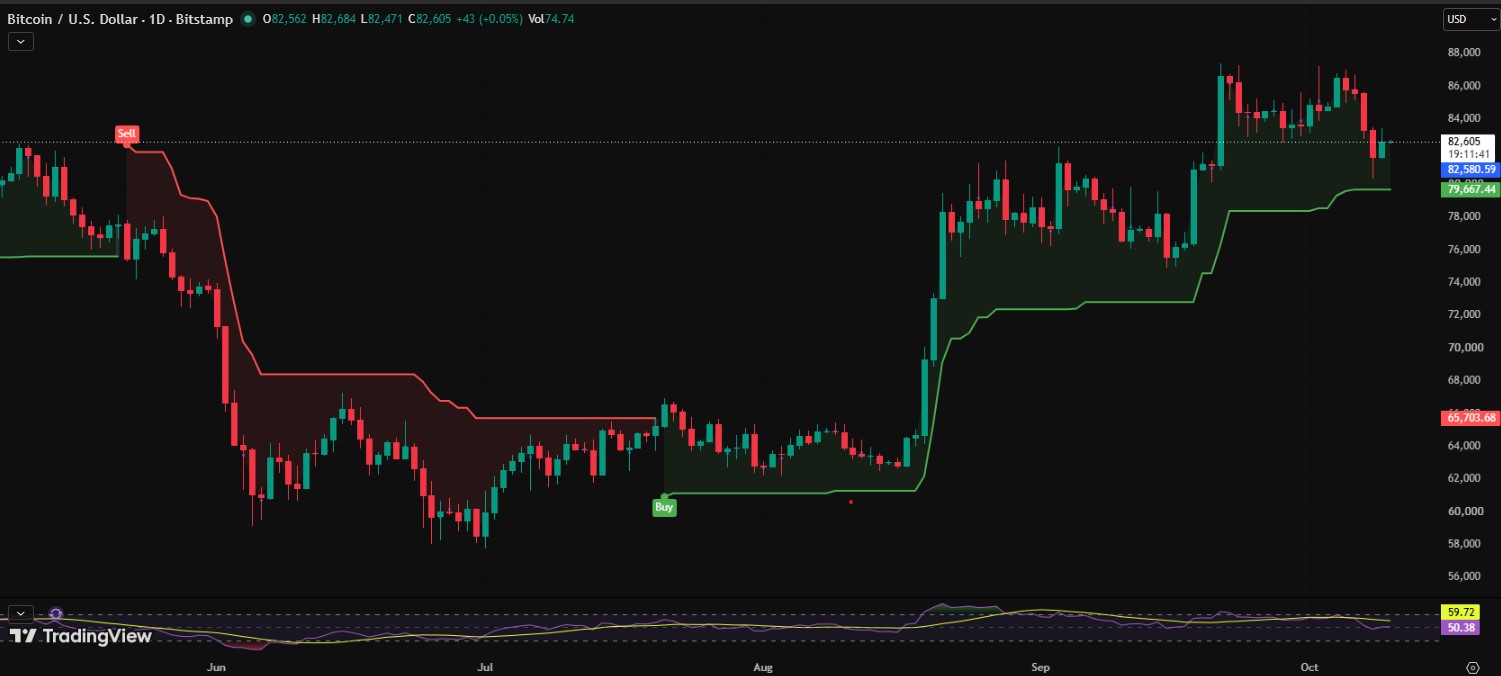
What Could Move BTC Price Next?
Watch $79,600 on the downside and $84,000 on the upside. Also watch volume and ETF flows. A real move needs both.
Short squeezes and sudden drops can both happen fast in crypto. Plan for either case.
Disclaimer
This article is for information only and is not financial advice. Crypto is volatile, and you can lose money. Price predictions are opinions, not guarantees. Do your own research before you invest.
