TLDR: Bitcoin price is testing the $63,150 Fibonacci support after losing most of its recovery from July’s $66,900 high and facing further downside risk. US spot Bitcoin ETFs still gained abo
TLDR:
- Bitcoin price is testing the $63,150 Fibonacci support after losing most of its recovery from July’s $66,900 high and facing further downside risk.
- US spot Bitcoin ETFs still gained about $172.4 million in July, despite a $265.4 million net outflow during the final trading session.
- Momentum remains weak as Bitcoin trades below the four-hour Bollinger midpoint, while money flow and the daily MACD favor sellers.
- BTC dominance has broken a weekly trendline, but a broad altseason still needs stronger liquidity, market breadth, and sustained altcoin gains.
Bitcoin price entered August under pressure after retreating from July’s $66,900 peak. The asset traded near $63,000 after briefly slipping below that mark. Sellers now test the $63,150 Fibonacci support, which separates consolidation from a deeper pullback. A daily close below it could expose $62,000 and later $60,000.
However, July’s institutional flow picture stayed positive. US spot Bitcoin ETFs collected about $172.4 million during the month. That gain survived heavy selling during the final sessions. The result suggests large investors reduced exposure selectively rather than abandoning Bitcoin.
 Bitcoin (BTC) Price
Bitcoin traded near $62,979 early Saturday, with an intraday low around $62,426. Price must reclaim $64,000 before short-term pressure eases. The next important resistance sits between $65,000 and $66,000.
Bitcoin Price Holds Support as ETF Demand Survives July
Bitcoin ETFs recorded a $265.4 million net outflow on July 31. BlackRock’s IBIT led withdrawals with $122.7 million. Fidelity’s FBTC lost $54.8 million, while GBTC posted $52.6 million in outflows. Bitwise and ARK products also recorded smaller withdrawals.
Even so, the full-month balance stayed green. That contrast matters because late-month selling followed several strong inflow sessions. July 20 brought $226.8 million, while July 21 added $203.2 million. Funds also attracted $233.1 million on July 30.
The monthly result shows institutions still use weakness to adjust positions. It does not guarantee an immediate Bitcoin price rebound. ETF flows can support demand, yet derivatives and macro conditions often control shorter moves.
Momentum indicators currently favor sellers. The daily relative strength index sits near 45, below its recent average. Meanwhile, the daily MACD has crossed lower, with its histogram moving into negative territory.
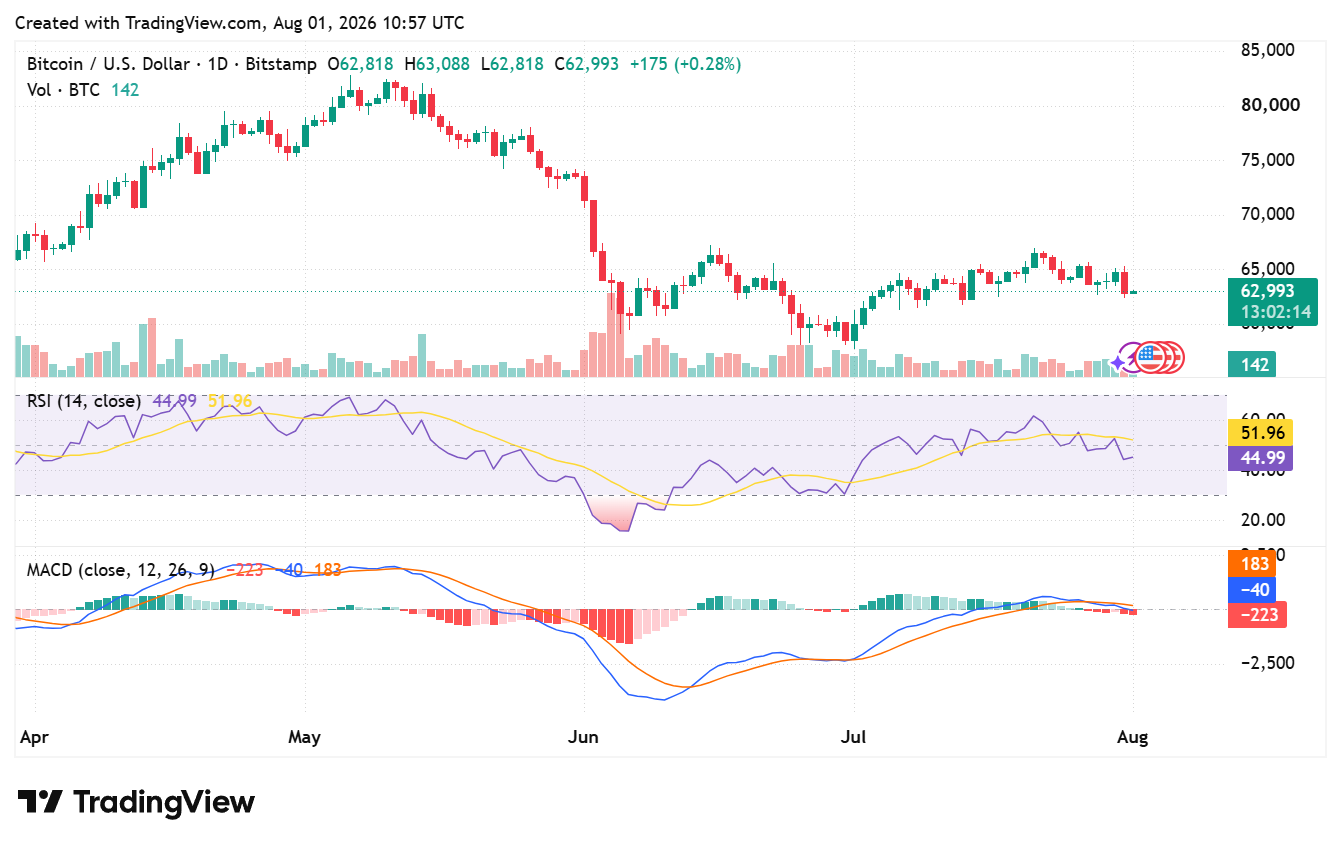
BTC/USD daily chart. Source: TradingView
The four-hour chart also shows weakening capital flow. Chaikin Money Flow fell to minus 0.22, suggesting persistent distribution. Bitcoin trades below the Bollinger midpoint near $63,886. The lower band around $62,489 now acts as immediate support.
Liquidation clusters sharpen those levels. Leveraged long positions gather near $62,000, while short exposure builds between $65,000 and $66,000. A downside sweep could trigger forced selling before buyers attempt another recovery.
Policy uncertainty adds another risk layer. The Senate has limited time before its August recess, while the CLARITY Act still needs bipartisan support. Prediction markets show reduced confidence in passage during 2026.
Bitcoin Price Risks $62K Sweep as BTC Dominance Weakens
BTC dominance has also drawn attention after a weekly trendline breakdown and failed retest. According to market data, the measure is near 58.95%. However, dominance readings vary across platforms because providers calculate the broader crypto market differently.

Source:
CryptoPatel on XThe bearish dominance setup supports growing altseason expectations. Traders often interpret falling BTC dominance as capital rotation toward Ethereum and smaller tokens. Similar declines accompanied major altcoin rallies during 2018 and 2021.
Still, a dominance breakdown alone cannot confirm another broad altseason. Altcoins continue losing ground while Bitcoin chops below its 21-day moving average. Rotation needs stronger breadth, improving liquidity, and sustained gains across several sectors.
Bitcoin’s price therefore remains the market anchor. Holding above $60,000 would preserve a higher low against June’s $57,884 bottom. That structure would also support the bullish divergence highlighted by some traders.
A recovery starts with the four-hour midpoint near $63,886. Clearing $64,000 could open $65,000 and the upper Bollinger band near $65,284. Stronger momentum would then target $65,800 to $66,000.
The broader breakout remains incomplete below July’s $66,900 high. Buyers must also clear the $67,284 Fibonacci level. Failure at $63,150 would instead expose $62,000. The next downside levels sit at $60,000 and June’s $57,884 low.
The post Bitcoin Price Faces $62K Risk Despite Positive July ETF Flows appeared first on Blockonomi.