$BTC Struggles Below $63,000 After Fresh Middle East Tensions $BTC is trading around $62,767, down about 1.53% on the day, according to TradingView charts on Bitstamp. The chart shows BTC ope
$BTC Struggles Below $63,000 After Fresh Middle East Tensions
$BTC is trading around $62,767, down about 1.53% on the day, according to TradingView charts on Bitstamp.
The chart shows BTC opened at $63,744 and touched a high of $64,385 before slipping back.
Price is now testing a small falling wedge pattern that formed after the early June drop from the $80,000 zone.
The Bitcoin price prediction July 2026 outlook depends heavily on whether bulls can defend the $58,000 to $60,000 support band seen on the daily chart.
Why Is $BTC Price Dropping Today?
The latest leg down followed news that U.S. Central Command forces launched fresh strikes against Iran at 5 p.m. ET.
The strikes aim to limit Iran's ability to threaten commercial ships in the Strait of Hormuz.
Iran has vowed to retaliate, and that kind of headline tends to push traders away from riskier assets like crypto.
The coin had already been fighting resistance near the psychological $65,000 mark before this news hit.
Bitcoin Price Chart: Key Levels To Watch
Level Type
Price Zone
Notes
Resistance
$65,000
Psychological level, recent rejection point
Resistance
$80,000–$82,500
Upper boundary of prior rising channel
Support
$60,000–$58,000
Tested in early July, held so far
RSI (14)
47.63
Neutral, no strong momentum either way
The RSI sitting near the midline suggests the market has not picked a clear direction yet.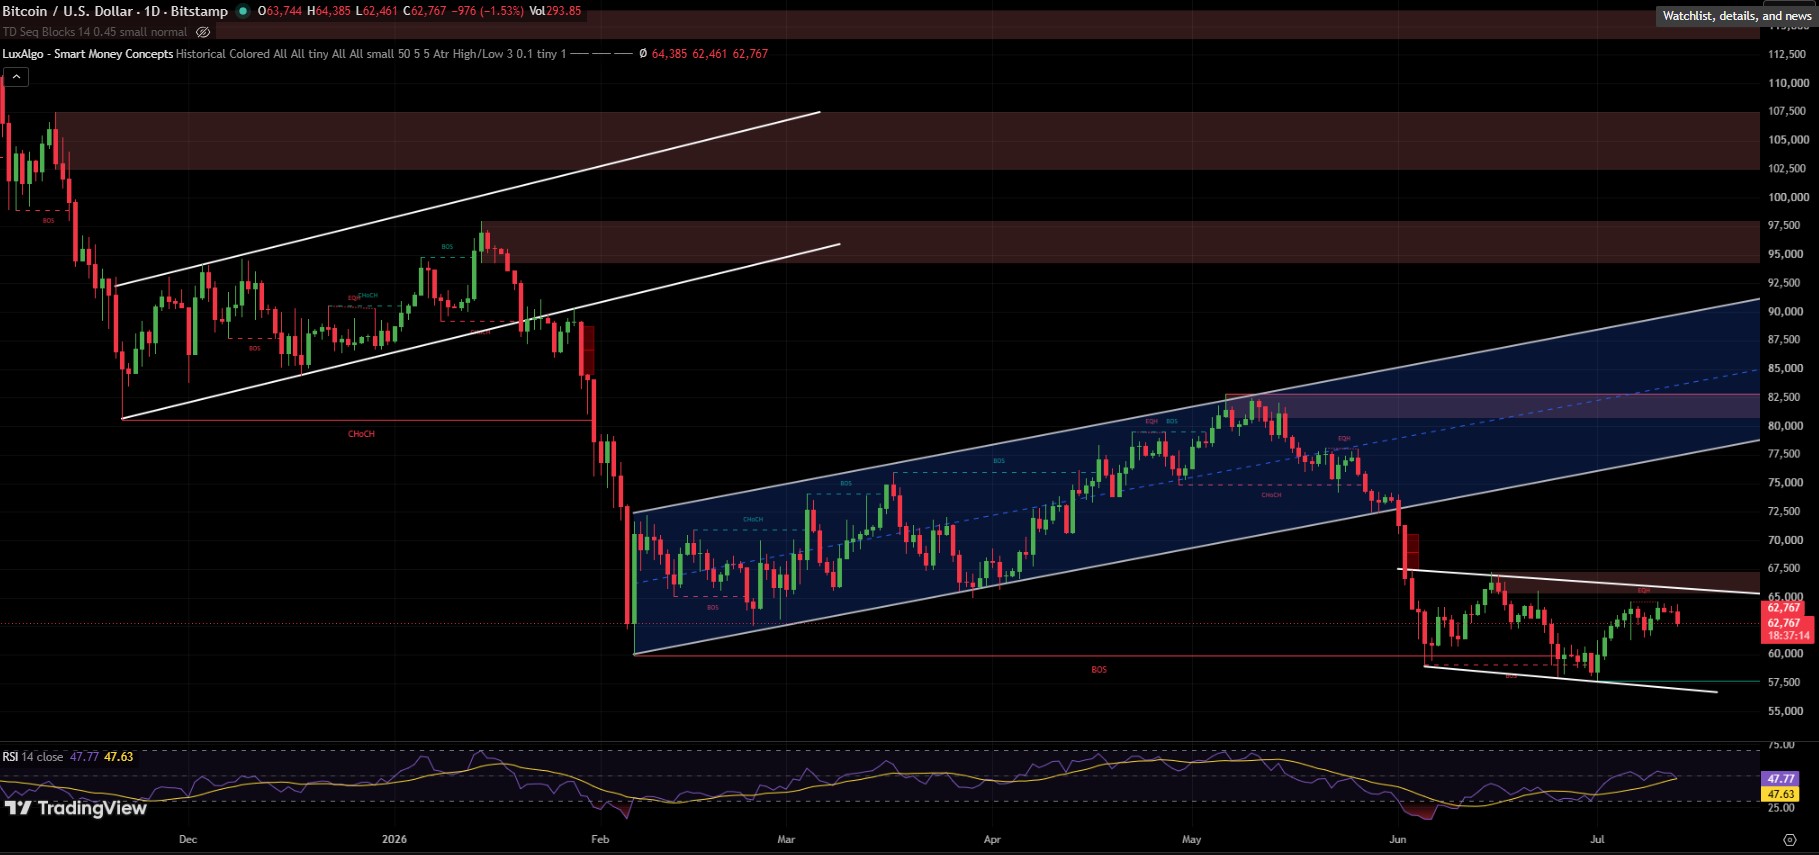
$BTC On-Chain Activity Is Cooling Off
Data shared by Ali Charts shows weekly active Bitcoin addresses fell by 7.6%, dropping from around 660,000 to 610,000.
Fewer active wallets can be a sign that everyday network usage is slowing, even if price stays range-bound.
This kind of on-chain cooling often shows up before bigger price swings, though it does not point to a direction on its own.
$BTC ETF Inflows Return After Eight-Week Outflow Streak
US spot BTC ETFs recorded $197.4 million in net inflows for the week ended Friday.
This snapped an eight-week streak of outflows, which had pulled a total of $8.26 billion out of these funds since May 11.
BlackRock's iShares Bitcoin Trust led the pack with $291.9 million in inflows, even as some smaller funds still saw withdrawals.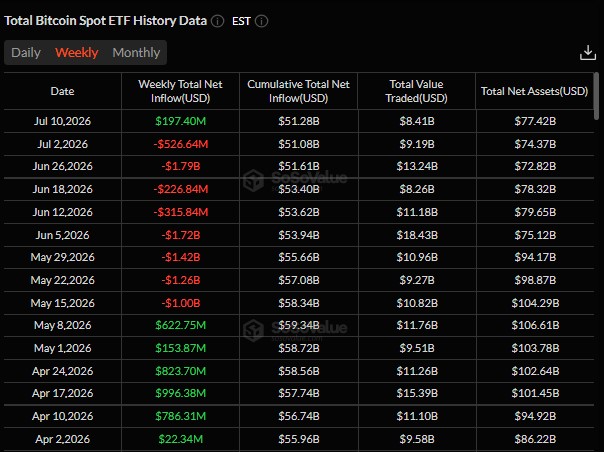
This shift matters for any Bitcoin price prediction July 2026, since ETF demand has been one of the bigger price drivers this cycle.
What Is Michael Saylor and Strategy Doing With BTC?
Michael Saylor posted Strategy's 25th tracker update of 2026, and the numbers are large.
Strategy now holds 843,775 BTC, worth close to $54 billion at current prices.
Metric
Figure
Total BTC Held
843,775
Average Entry Price
$75,653
Total Investment
$63.83 billion
Current Value
~$54 billion
Unrealized PnL
-$10 billion (-16%)
Purchase Rights
115
Saylor also described BTC as a network of wallets weighted by satoshis, with miners and nodes balancing out consensus and security.
The market is now watching whether Strategy announces another buy on Monday, or takes the rare step of trimming its position.
Given the company's long-standing accumulation strategy, most traders expect another purchase rather than a sale.
American Bitcoin Shares Fall Despite Growing BTC Treasury
Away from Strategy, American Bitcoin's stock has dropped more than 95% from its peak.
That decline wiped out over $600 million of value from Eric Trump's stake in the company.
The company still grew its Bitcoin treasury past 8,000 BTC, and lowered its mining cost per coin.
But a 1-for-15 reverse split to meet Nasdaq's minimum price rule did not stop the stock slide, and the company posted a $118.2 million operating loss in Q1 2026 due to a non-cash BTC valuation charge.
This shows that a growing Bitcoin treasury does not always translate into a stronger stock price.
Bitcoin Price Prediction July 2026: What Could Happen Next
The world's largest cryptocurrency started July with a sharp recovery after dipping briefly below $58,000.
That rebound carried price back toward $64,500, before the Iran-related headlines dragged it back under $63,000.
For the Bitcoin price forecast to turn bullish, BTC likely needs a daily close back above $65,000 alongside continued ETF inflows.
A failure to hold the $58,000 support zone could open the door to a deeper pullback, especially if geopolitical tensions escalate further.
Right now, the setup looks like a market waiting for its next clear signal, rather than one committed to a direction.
Disclaimer
This article is for informational purposes only and should not be considered financial or investment advice. Cryptocurrency markets are highly volatile, and prices can rise or fall sharply within short periods. Always do your own research and consult a licensed financial advisor before making any investment decisions.