Bitcoin is trading about 11 percent below its 200-day moving average on Sunday evening. The Mayer Multiple, meaning the price divided by that average, stood at 0.88 at around 5:40 pm CET acco
Bitcoin is trading about 11 percent below its 200-day moving average on Sunday evening. The Mayer Multiple, meaning the price divided by that average, stood at 0.88 at around 5:40 pm CET according to our calculation from Bitstamp daily closing prices. The metric was last this low on August 1, 2026. The facts: the price is about $64,500, the average of the last 200 daily closes is $72,919, and the current week is down 13.7 percent. Our assessment follows further below: in the past, a reading below 0.9 was more often a stopover than a bottom.
Our Bitcoin price prediction sets out where the price could head over the coming months. This article looks at a narrower slice: what the Mayer Multiple says about the distance from the trend, how things played out after 19 comparable cases since 2014, and which levels follow from that for the coming weeks. At the end you will find what you can check before year-end, from your cost basis to your liquidation price.
Mayer Multiple at 0.88: Bitcoin falls 11 percent below the 200-day line
The gap opened within a few days. On Monday, November 9, Bitcoin still closed at $75,267 on Bitstamp, and the Mayer Multiple was 1.03, just above the 200-day line. On Thursday the price slipped below it at $71,374, followed by $68,226 on Friday and $64,114 on Saturday. On Sunday Bitcoin fell as low as $61,947 during the day before buyers lifted it back above $64,000. According to CoinGecko, one Bitcoin cost $64,648, or 58,648 euros, on Sunday evening.
The 200-day line itself barely moves. The average stands at $72,919 and was $72,360 thirty days ago. Because the average is so sluggish, the Mayer Multiple falls almost entirely because of the price. At $79,742, the 50-day line is still clearly above it, so there is no death cross between the two lines.
Mayer Multiple explained: a metric for the distance from the trend
The Mayer Multiple is the ratio of the current price to the simple average of the last 200 daily closing prices. A value of 1.0 means the price sits exactly on the line. A value of 0.9 would mean Bitcoin costs 10 percent less than its average over the past six and a half months or so. The metric was popularised by Bitcoin investor Trace Mayer, after whom it is named. In his reading, a value above 2.4 was a sign of overheating.
The metric has two weaknesses worth knowing. First, it depends on a single average, which by nature lags the market. After a long rally the line sits low, after a long downturn it sits high. Second, the Mayer Multiple says nothing about what triggered a move. Fund flows, interest rates or liquidations in the futures market move the price; the metric only shows how far it has already strayed from the trend.
For our analysis we took Bitstamp daily closing prices since January 2012 and calculated, for each day, the ratio of the close to the 200-day average. Since 2014, the Mayer Multiple has been at 0.88 or lower on just over 28 percent of all days. Today's value is therefore no state of emergency but a phase Bitcoin passes through almost every year.
Fear index falls from 13 to 10: little has improved since Saturday evening
In our Bitcoin analysis on Saturday evening, the price was around $65,500 and the Fear and Greed Index stood at 13. We named $66,500 as the first resistance and, below that, the zone around $58,500, the lowest close of the year. Since then the picture has shifted only in nuances. The Alternative.me index stands at 10 on Sunday, the lowest reading this week. Bitcoin has not reclaimed $66,500 and fell to just above $62,000 overnight into Sunday.
What is new is the view of the trend. The 200-week line, which we put at around $67,900 on Saturday, is at $67,973 according to our calculation from Bitstamp weekly closes. The price is therefore below both long averages at once, the 200-week line and the 200-day line. The week also closes overnight into Monday. If the price stays below $64,350 until then, it will be the weakest week since the first week of June 2026, when Bitcoin lost 13.9 percent.
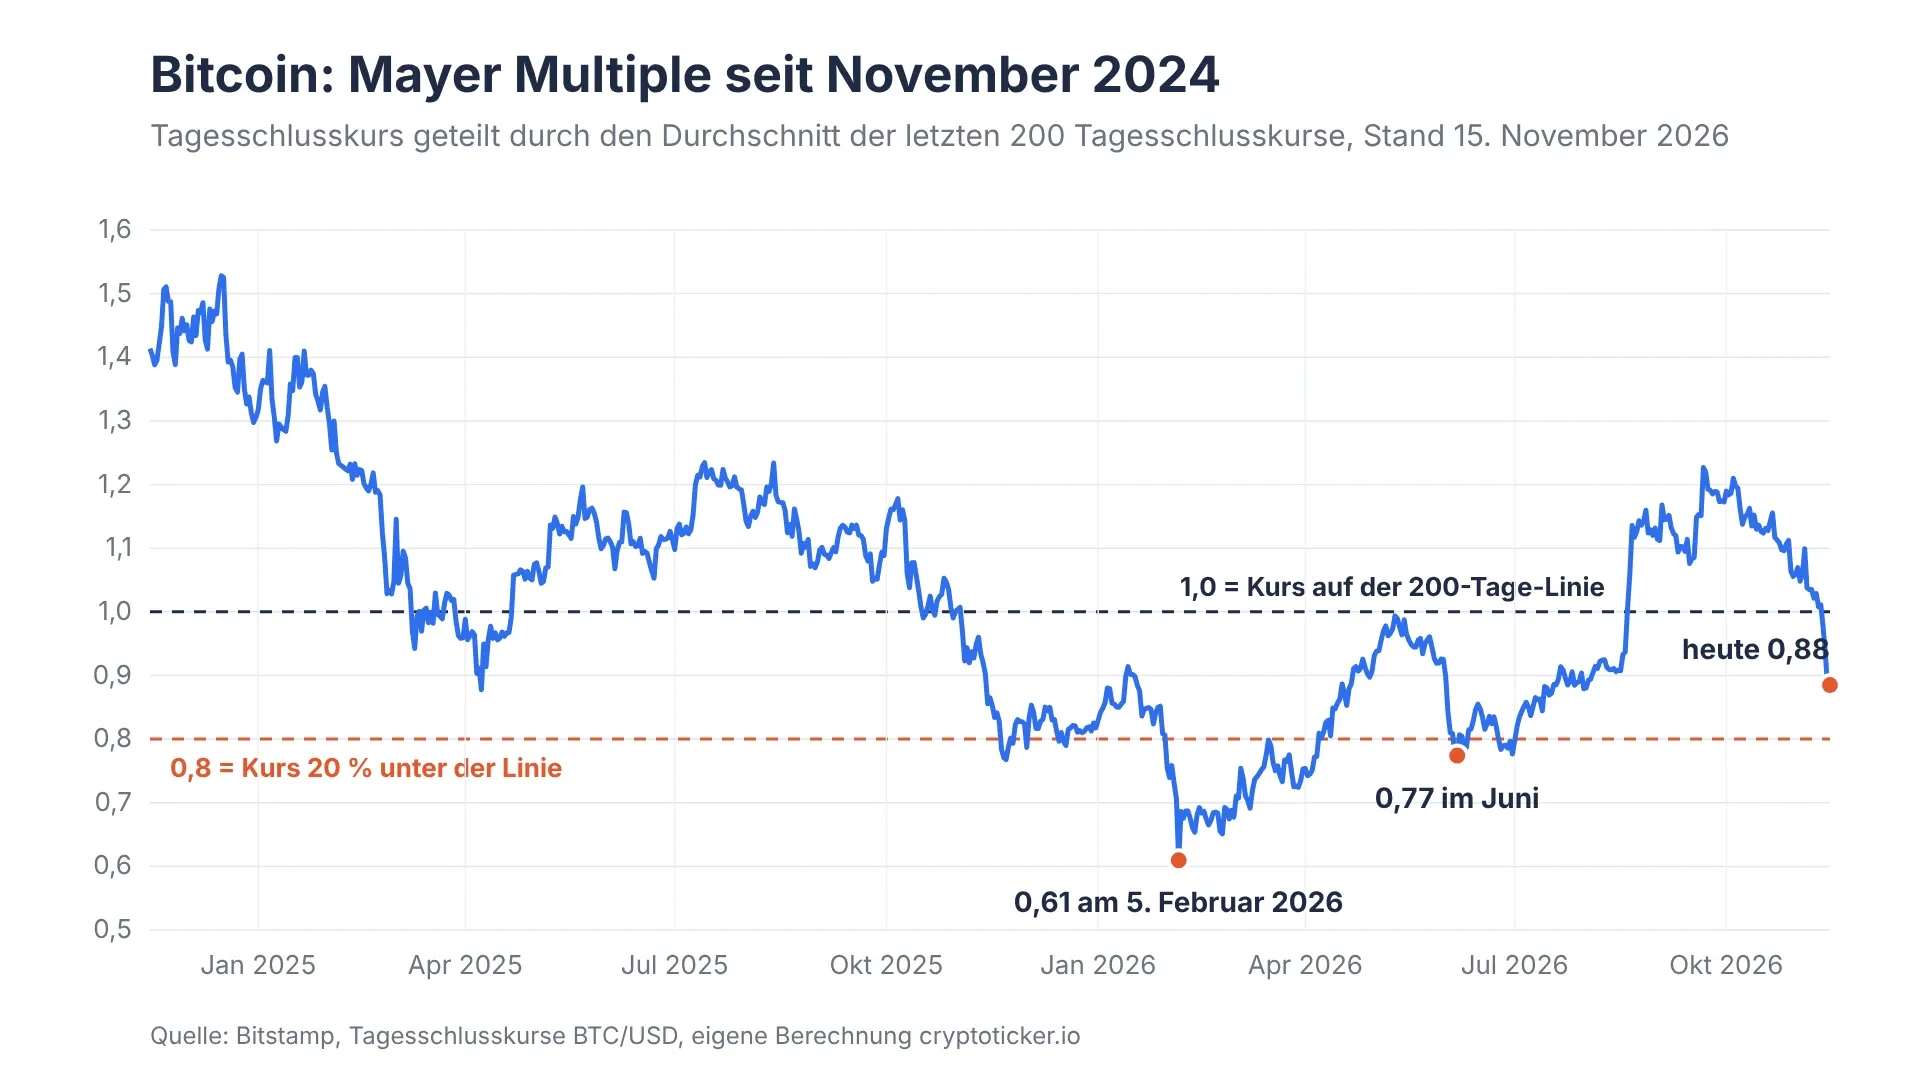
The Mayer Multiple fell to 0.61 in February 2026 and to 0.77 in June. Today it stands at 0.88.
Mayer Multiple in hindsight: 19 cases since 2014 and what came next
How often did a reading below 0.885 lead to a recovery? We counted every case since 2014 in which the Mayer Multiple fell below that threshold after having first returned to at least 0.97. That way a long weak phase counts only once. There are 19 completed cases, and today's is the twentieth.
In 12 of the 19 cases, Bitcoin was higher 90 days later than on the signal day. The median was a gain of 17.9 percent. That is one half of the finding. The other: within those 90 days, the price first fell a median 15.5 percent further before the direction became clear. Anyone who bought on the signal day usually had to sit through another setback.
The range is wide. On March 12, 2020, during the Covid crash, the Mayer Multiple jumped straight to 0.56, and 90 days later Bitcoin was 104 percent higher. September 5, 2024, was followed by a gain of 75.9 percent. The last case before today's began on June 2, 2026, at $66,669. Bitcoin then fell to a close of $58,526 on June 30, a drop of 12.2 percent, and was still 17.9 percent higher after 90 days.
Bear markets of 2022 and 2025: when the Mayer Multiple fell to 0.48 and 0.61
Two cases show why a value of 0.88 is not a buy signal in itself. On April 8, 2022, the Mayer Multiple slipped below the threshold at $42,290. Then came the collapse of Terra in May and the crisis of the lending platforms in June. After 90 days Bitcoin was 48.8 percent lower, and the metric hit its cycle low of 0.48 in June 2022.
The second case was exactly one year ago. On November 14, 2025, the Mayer Multiple fell below 0.885 at $94,509. Three months later Bitcoin was 29.9 percent lower, and on February 5, 2026, the metric stood at 0.61, its lowest since the 2022 bear market. What both cases share is that after the first slide below the 200-day line the price did not come back; instead the line itself turned down.
That is exactly the point to watch. As long as the 200-day line runs flat or slightly upward, as it does now, the gap is a swing. Once it starts to fall, the swing becomes a trend. Today it is still rising slightly, from $72,360 to $72,919 in 30 days.
Bitcoin price prediction: levels between $51,000 and $73,000
The Mayer Multiple can be translated into dollar levels. At today's 200-day line, a value of 0.8 corresponds to a price of $58,335. That is just below the year's lowest close of $58,526 on June 30. The next step, 0.7, would be at $51,043. Bitcoin reached that area in February 2026, when the metric fell to 0.61.
On the upside, two levels are stacked on top of each other. The first is the 200-week line at $67,973. The second is the 200-day line itself at $72,919. A daily close above it would bring the Mayer Multiple back to 1.0 and fully reverse this week's slide. In between lies the $66,500 level, which broke on Saturday and has acted as resistance since.
For the coming days, Sunday's intraday low of $61,947 counts first. If the price closes below it, the zone between $58,300 and $58,500 comes into view, where the 0.8 Mayer level and the year's low almost coincide. If the intraday low holds, a rebound to the 200-week line is the obvious first step.
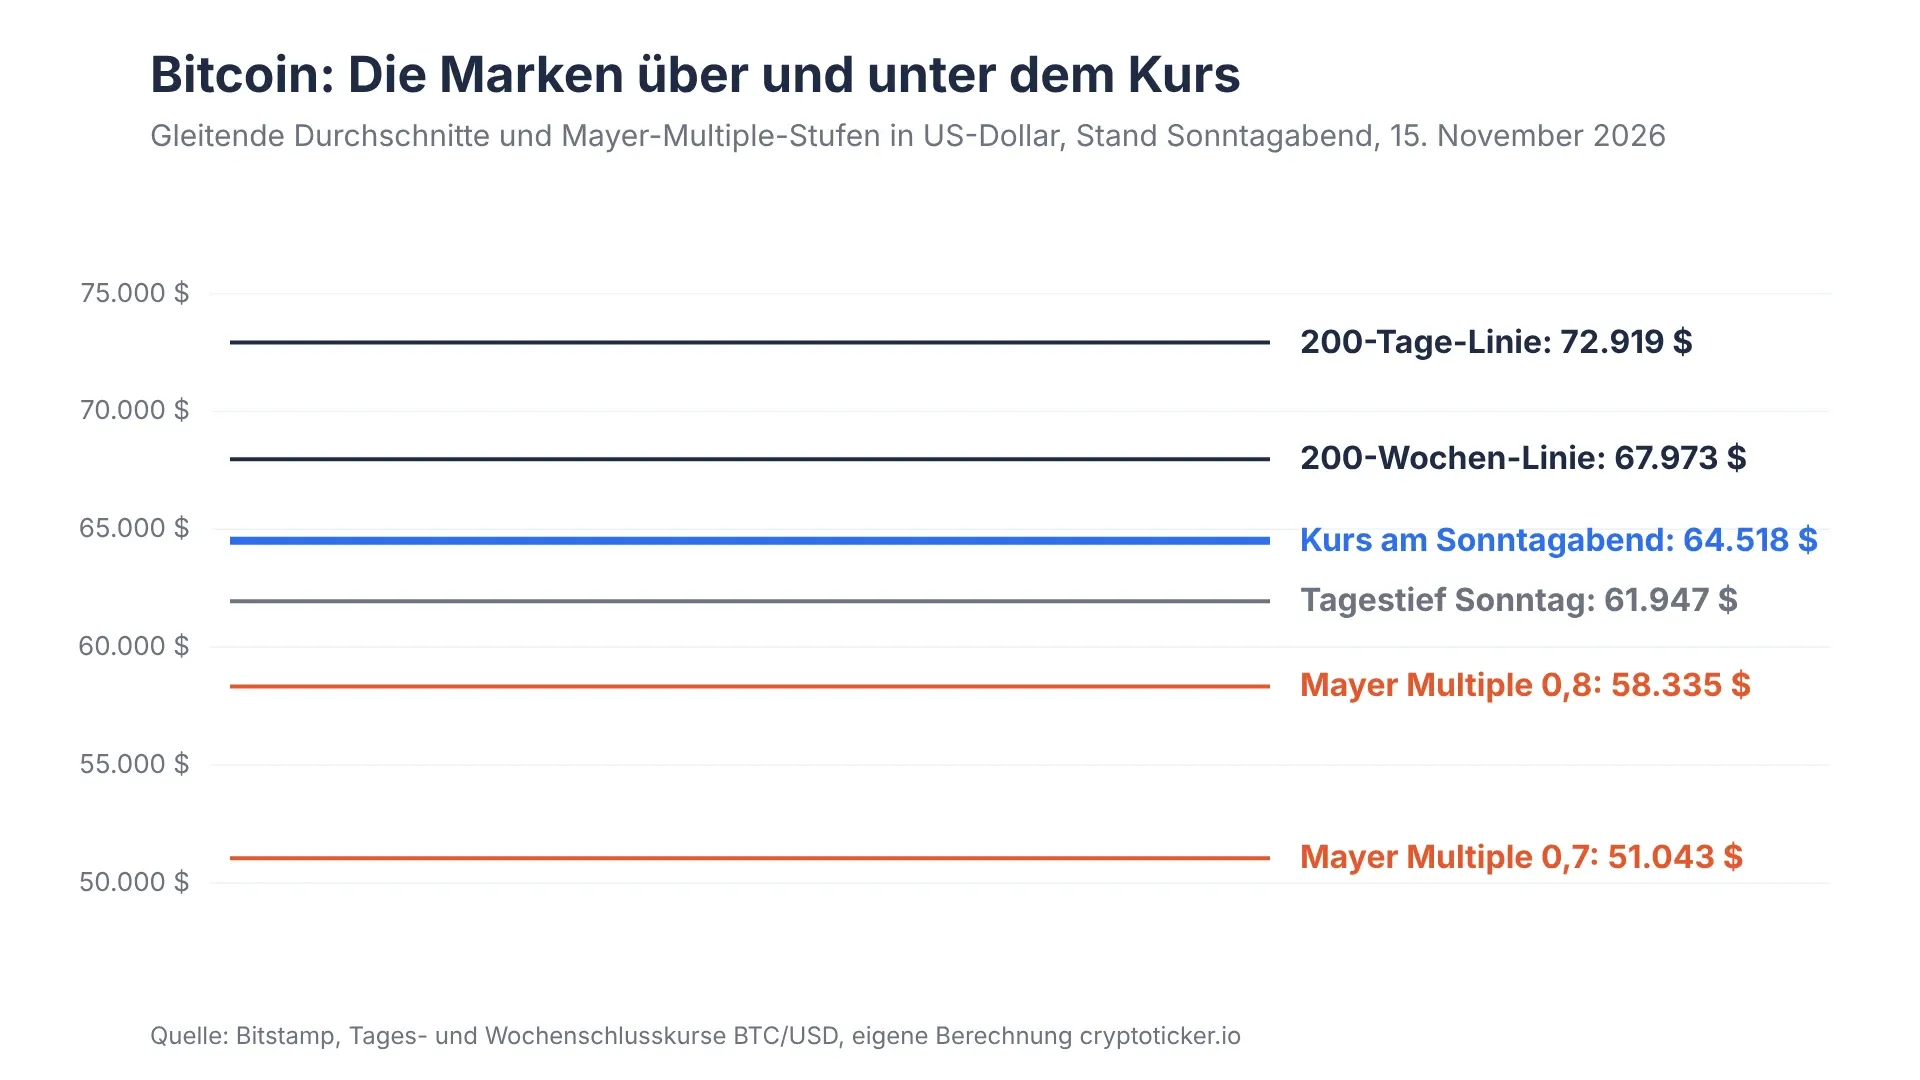
Just over $3,400 separates the intraday low from the year's low, and the 200-day line is just over $8,000 away.
Our view on the Bitcoin price: a bottom is not yet confirmed
Our assessment: the distance from the 200-day line alone does not yet make a turnaround. The historical record argues for one, since Bitcoin was higher after 90 days in 12 of 19 cases, and the line is still rising slightly. Three things argue against it. The median of the cases first shows a further decline of about 15 percent, which from today's price would end at around $55,000. The fear index stands at 10, so sentiment is already poor, but in the bear markets of 2022 and 2025 the low in sentiment did not coincide with the low in price. And the price is below the 200-week line, which in earlier cycles tended to act as the lower boundary.
In the editorial team's view, the direction is likely to be decided at two levels: the intraday low of $61,947 on the downside and the 200-week line at $67,973 on the upside. This assessment changes as soon as Bitcoin closes above $67,973 on a daily basis again. It is confirmed if the 200-day line starts to fall. This is not a recommendation to buy or sell, and a total loss remains possible with cryptocurrencies.
Before year-end, a clean record of your purchase prices and dates matters more than any chart; a crypto tax tool brings together the buys across exchanges and wallets.
Leverage on Bitcoin: a 5x long is liquidated near $51,600
If you trade with leverage, you should know the distance to liquidation in dollars. A long position with 5x leverage opened at $64,500 loses its margin, in arithmetic terms, after a 20 percent decline, so at around $51,600. Fees and the exchange's maintenance margin pull the liquidation price up a little further. The proximity to the 0.7 Mayer level at $51,043 is notable: a relapse into February's range would hit exactly these positions.
With 10x leverage the threshold is around $58,000, already in the area of the year's low. According to our report on Sunday morning, based on CoinGlass data, positions worth about $2 billion were forcibly closed within 24 hours, mostly longs on Bitcoin and Ether. If you use derivatives, you will find the providers' fees and margin rules in our perp exchange comparison.
If you buy without leverage, in the EU you need an exchange licensed under the European MiCA regulation. Such an exchange must hold customers' coins separately from its own assets and is supervised. Differences lie in fees, spreads and whether you can withdraw coins to your own wallet. Our exchange comparison lists the terms of the licensed providers.
Mayer Multiple at 0.88: only above $72,900 does the picture turn
- Check your cost basis: List every Bitcoin position with its purchase date and price. A tax tool from our comparison does this across several exchanges.
- Set your levels: Note $61,947 on the downside and $67,973 on the upside. If you want to buy, you can place limit orders at these levels on an exchange from our crypto exchange comparison instead of chasing the price.
- Limit leverage: Work out the liquidation price of every position in dollars and keep it below $58,300, the zone formed by the year's low and the 0.8 Mayer level. The derivatives providers' terms are in the perp comparison.
(As of November 15, 2026. This article is not investment advice. Prices and fee structures change; check the terms with the provider before you buy.)