Bitcoin climbed back above $83,500 on Tuesday after a quick dip to just under $81,000. At the time of writing, BTC trades at $84,049.90, up $284.80 or 0.34% in 24 hours. The bounce came even
Bitcoin climbed back above $83,500 on Tuesday after a quick dip to just under $81,000. At the time of writing, BTC trades at $84,049.90, up $284.80 or 0.34% in 24 hours.
The bounce came even as a selloff in Asian chip stocks and U.S. tech futures hurt risk appetite. Now traders are waiting for Thursday's U.S. consumer price index (CPI) report.
What Is the Bitcoin Price Today?
BTC is holding above the $83,500 area after a choppy session. Ethereum bounced from five-day lows and trades near $2,532. XRP turned higher after touching three-week lows. Solana and Zcash followed a similar pattern.
Here is a quick look at the main numbers:
Metric
Value
BTC price
$84,049.90
24h change
+$284.80 (+0.34%)
Market cap
$1.68 trillion
Futures volume (24h)
$63.49 billion
Spot volume (24h)
$5.06 billion
Open interest
$53.62 billion
Circulating supply
20.09 million BTC
Max supply
21 million BTC
Bitcoin News Today: Why Is BTC Moving Ahead of CPI?
The Bitcoin CPI link is simple. Inflation data can change how investors see interest rates, and that often shifts risk appetite.
Paul Howard, senior director at Wincent, expects big investors to add protection with derivatives. He says they are more likely to hedge than to cut their core crypto holdings.
In today's BTC news today feed, ETF flows are a bit weak. U.S. spot Bitcoin ETFs saw a net outflow of $65.40 million on October 12, according to SoSoValue. BlackRock's IBIT accounted for all of it.
What Do Negative Funding Rates Mean? Is BTC Being Shorted?
The data looks mixed. The overall 24-hour long/short ratio is 0.929, which points to slightly more shorts. But account ratios on big exchanges lean long.
Indicator
Reading
Long/short ratio (24h)
0.929
Binance BTC/USDT accounts
1.2707
OKX BTC accounts
1.29
Binance top traders (accounts)
1.3132
Binance top traders (positions)
1.5661
Crypto Rover noted that funding rates fell to their most negative level since June. Negative funding means short traders pay longs. It can show crowded short bets.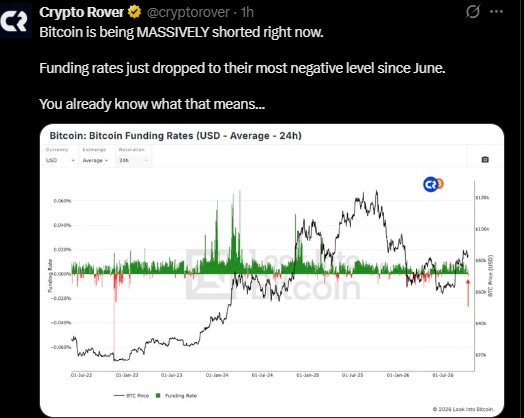
Liquidations hit $192.56 million in 24 hours. Longs took $143.12 million, and shorts took $49.44 million.
Window
Total
Longs
Shorts
1h
$1.75M
$75.30
$1.75M
4h
$16.98M
$169.23K
$16.81M
12h
$150.98M
$104.74M
$46.24M
24h
$192.56M
$143.12M
$49.44M
Derivatives are busy. Futures volume rose 84.59% and open interest gained 2.01%.
Options are active too. Volume jumped 87.27% to $2.97 billion, while options open interest rose 2.31% to $38.30 billion.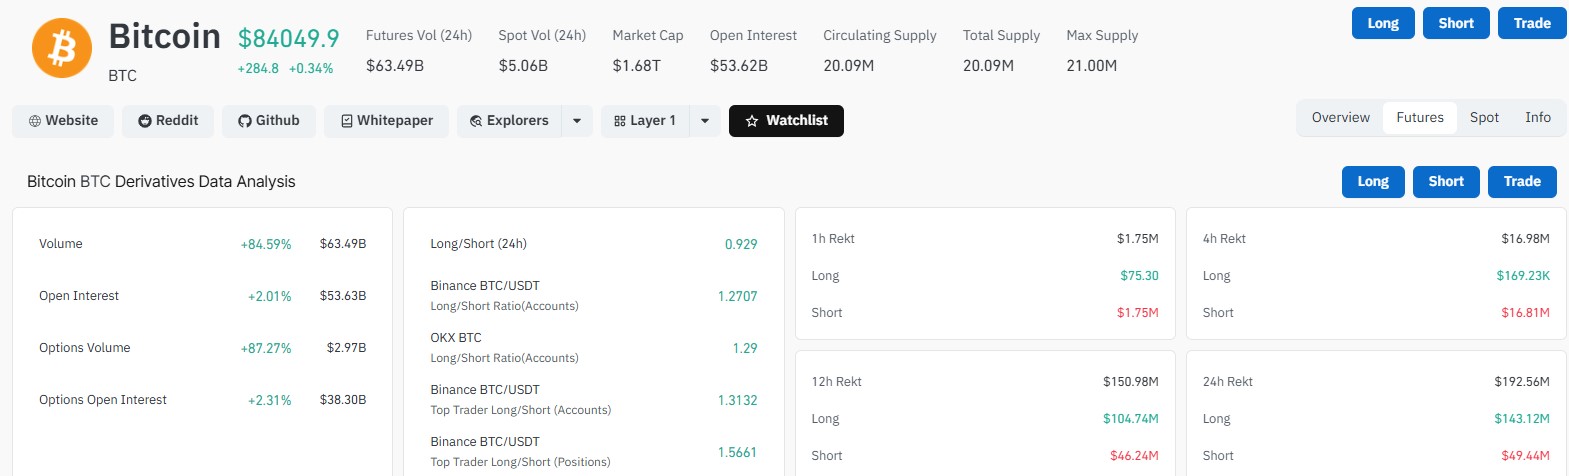
BTC Price Analysis: What Does the Weekly Chart Show?
On the weekly chart, BTC rebounded from the $60,000 to $65,000 zone. This week's candle opened at $83,679, hit a high of $84,254, and a low of $80,948.
Price now sits above all four key moving averages. The RSI is near 59.5, which suggests steady but not overheated momentum.
Weekly EMA
Level
20 EMA
$76,486
50 EMA
$78,562
100 EMA
$78,971
200 EMA
$69,514
The big hurdle is $87,376. BTC has failed to hold above this line in recent weeks.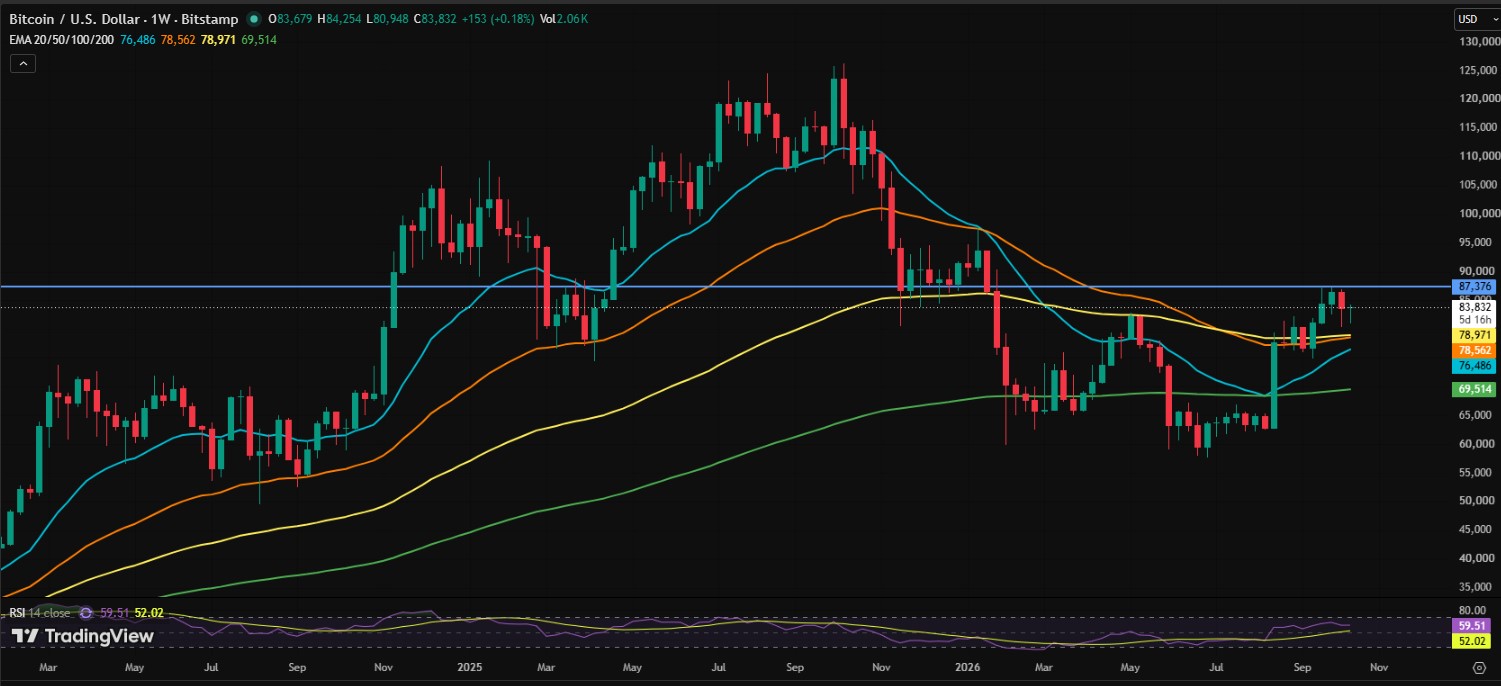
On the 4-hour chart, analyst Ali Charts points to $84,000, where the 50 SMA sits. A 4-hour close above it could confirm a move toward $93,000, he says. The last time BTC bounced from the bottom of this channel, the 200 SMA held.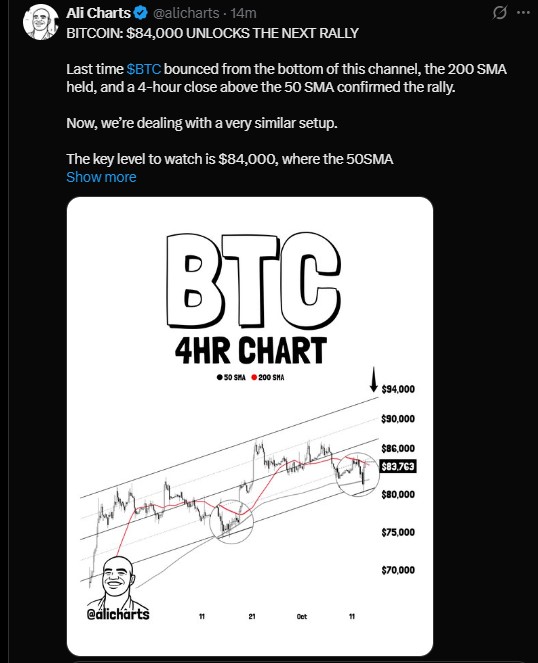
One post also claims a past golden cross marked the end of a bear market, followed by a 500% rally. That is a bold claim, and past moves do not guarantee future ones.
Why Is BTC Exchange Supply Dropping?
CryptoQuant data shows BTC supply on exchanges keeps shrinking. The reserve is now near 2.67 million BTC on the chart.
Fewer coins on exchanges can mean less selling pressure. But it only helps if buyers keep showing up.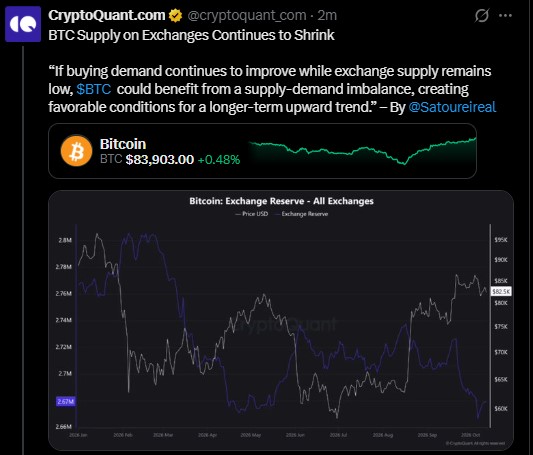
Bitcoin Price Prediction: Will BTC Hit $90,000 or Drop to $78,500?
This Bitcoin price forecast stays cautiously bullish. BTC holds above its major averages, but $87,376 still caps the move.
Scenario
What Needs to Happen
Possible Levels
Bullish
Strong break above $87,376 with volume
$90,000 to $95,000, then $100,000
Neutral
Price chops between $84,000 and $87,376
Range trading
Bearish
Rejection at $87,376
$80,000 to $78,500, then $76,500
Deeper drop
Break below $76,500
$70,000
CPI on Thursday could be the spark for either path. Short bets are crowded, so a quick squeeze is possible. A weak reaction could also push BTC back to support.
Nothing here is certain. Watch $84,000 on the 4-hour chart and $87,376 on the weekly.
Disclaimer
This article is for information only and is not financial, investment, or trading advice. Cryptocurrency prices are volatile, and you can lose some or all of your money. Price targets are possibilities, not promises. Do your own research and speak with a licensed financial advisor before you invest.