Bitcoin price fell toward $75,500 after the U.S. Senate rejected the CLARITY Act, while bearish momentum and nearby liquidation clusters raised the risk of another decline before the Federal
Bitcoin price fell toward $75,500 after the U.S. Senate rejected the CLARITY Act, while bearish momentum and nearby liquidation clusters raised the risk of another decline before the Federal Reserve’s rate decision.
Summary
- Bitcoin price traded near $75,940 after briefly sweeping the $75,350–$75,500 support area.
- The Senate’s 49-50 procedural vote left the CLARITY Act short of the required 60 votes.
- 4-hour RSI fell to 37.23 as BTC remained below the Bollinger Band midpoint.
- The daily chart places the next major Fibonacci support near $72,547.
According to data from crypto.news, Bitcoin (BTC) price traded at approximately $75,940 at press time, according to the 4-hour chart. The price had recovered slightly from an intraday low of $75,350 but remained under pressure after the CLARITY Act failed to advance in the U.S. Senate.
The procedural vote ended 49-50, leaving the proposed crypto market structure legislation 11 votes short of the 60 required to move forward. The setback weighed on digital assets and U.S.-listed crypto companies as traders reassessed the outlook for federal market rules.
Derivatives amplified the initial decline. Approximately $771 million in leveraged crypto positions were liquidated over 24 hours, including about $568 million in long positions, according to market data cited after the vote. The imbalance showed that traders positioned for higher prices were caught by Bitcoin’s move below $76,000.
You might also like: Bitcoin, Ether longs lose $380M after Senate vote
Bitcoin price loses 4-hour Bollinger midpoint
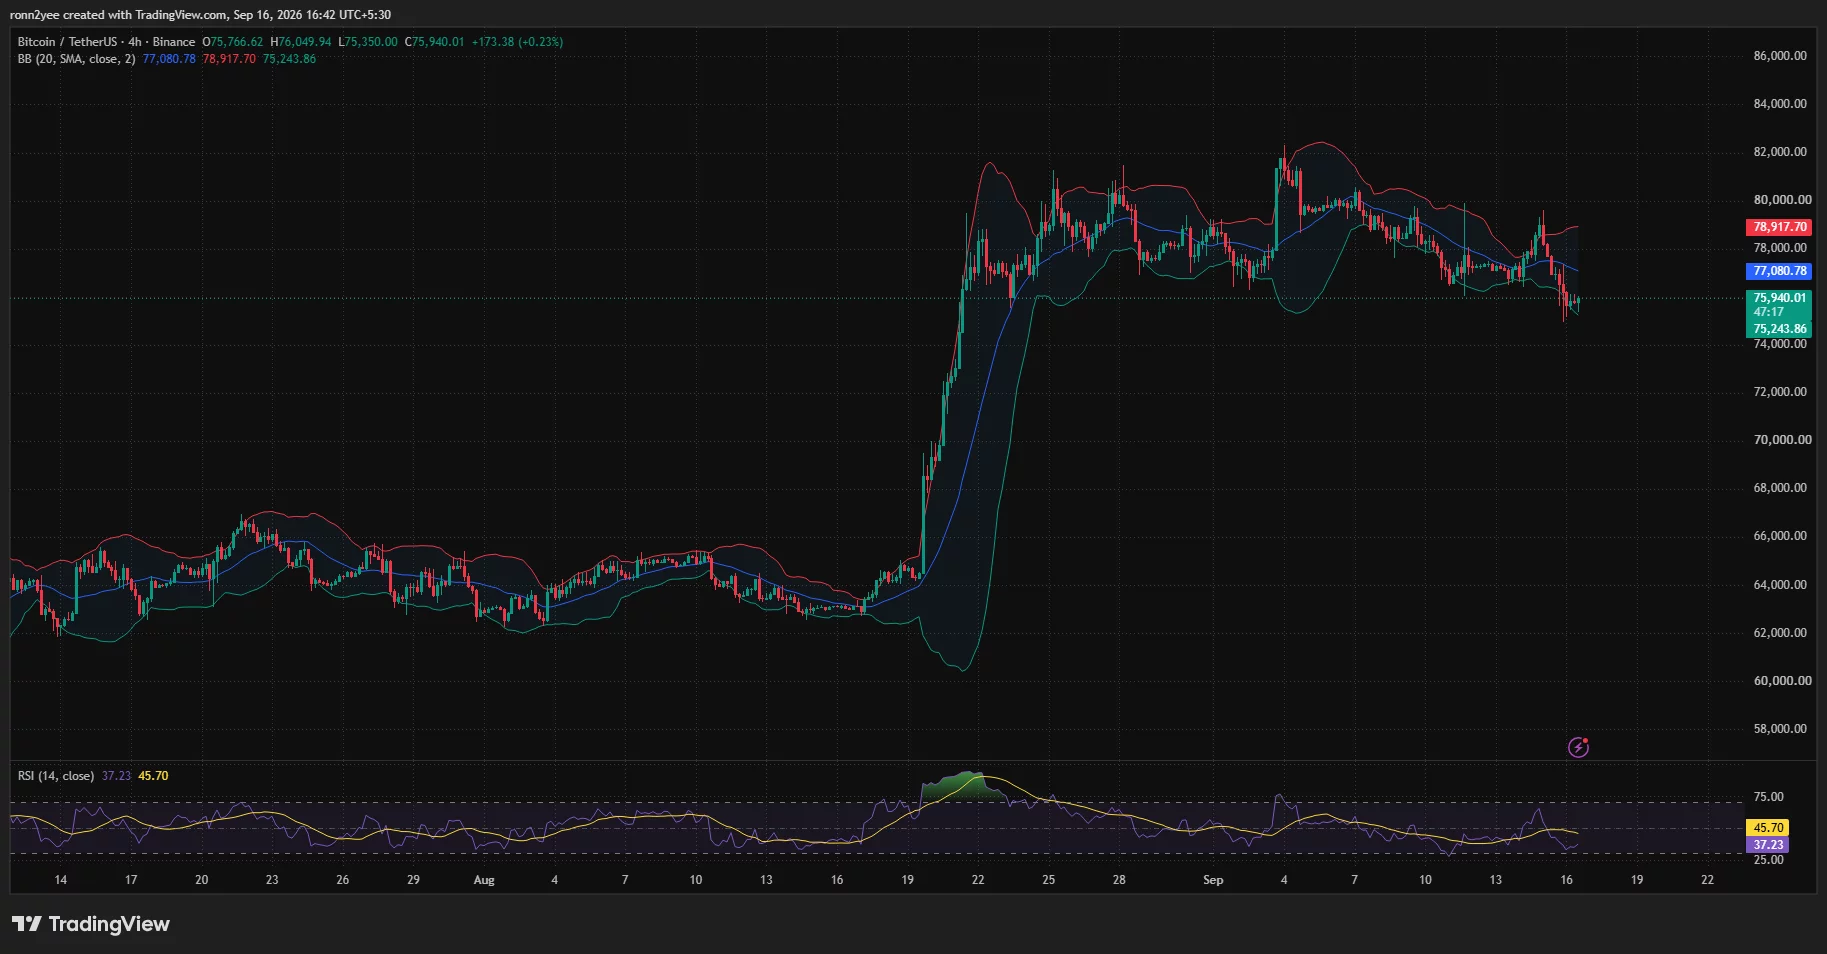
Bitcoin’s 4-hour chart shows that the price has moved below the Bollinger Band midpoint at $77,080. The level now forms the first major barrier for any short-term recovery.
Bitcoin price 4-hour chart — Sep. 16 | Source:
crypto.newsBTC also briefly fell through the lower Bollinger Band, which stood near $75,244, before returning inside the indicator. A move outside the lower band can signal heavy selling, but re-entry alone does not confirm that the correction has ended.
The 4-hour relative strength index stood at 37.23, below its signal average of 45.70. RSI remains above the conventional oversold boundary of 30, leaving room for further weakness if buyers fail to defend the $75,000 region.
The Bollinger Band structure places immediate resistance at $77,080, followed by the upper band near $78,918. Bitcoin would need to reclaim the midpoint and establish support above it to weaken the current bearish setup.
A failure to recover $77,000 could keep the focus on the lower band and the recent $75,350 low. A confirmed break below that area would expose the psychological $75,000 level.
Daily indicators point to $72,547 support
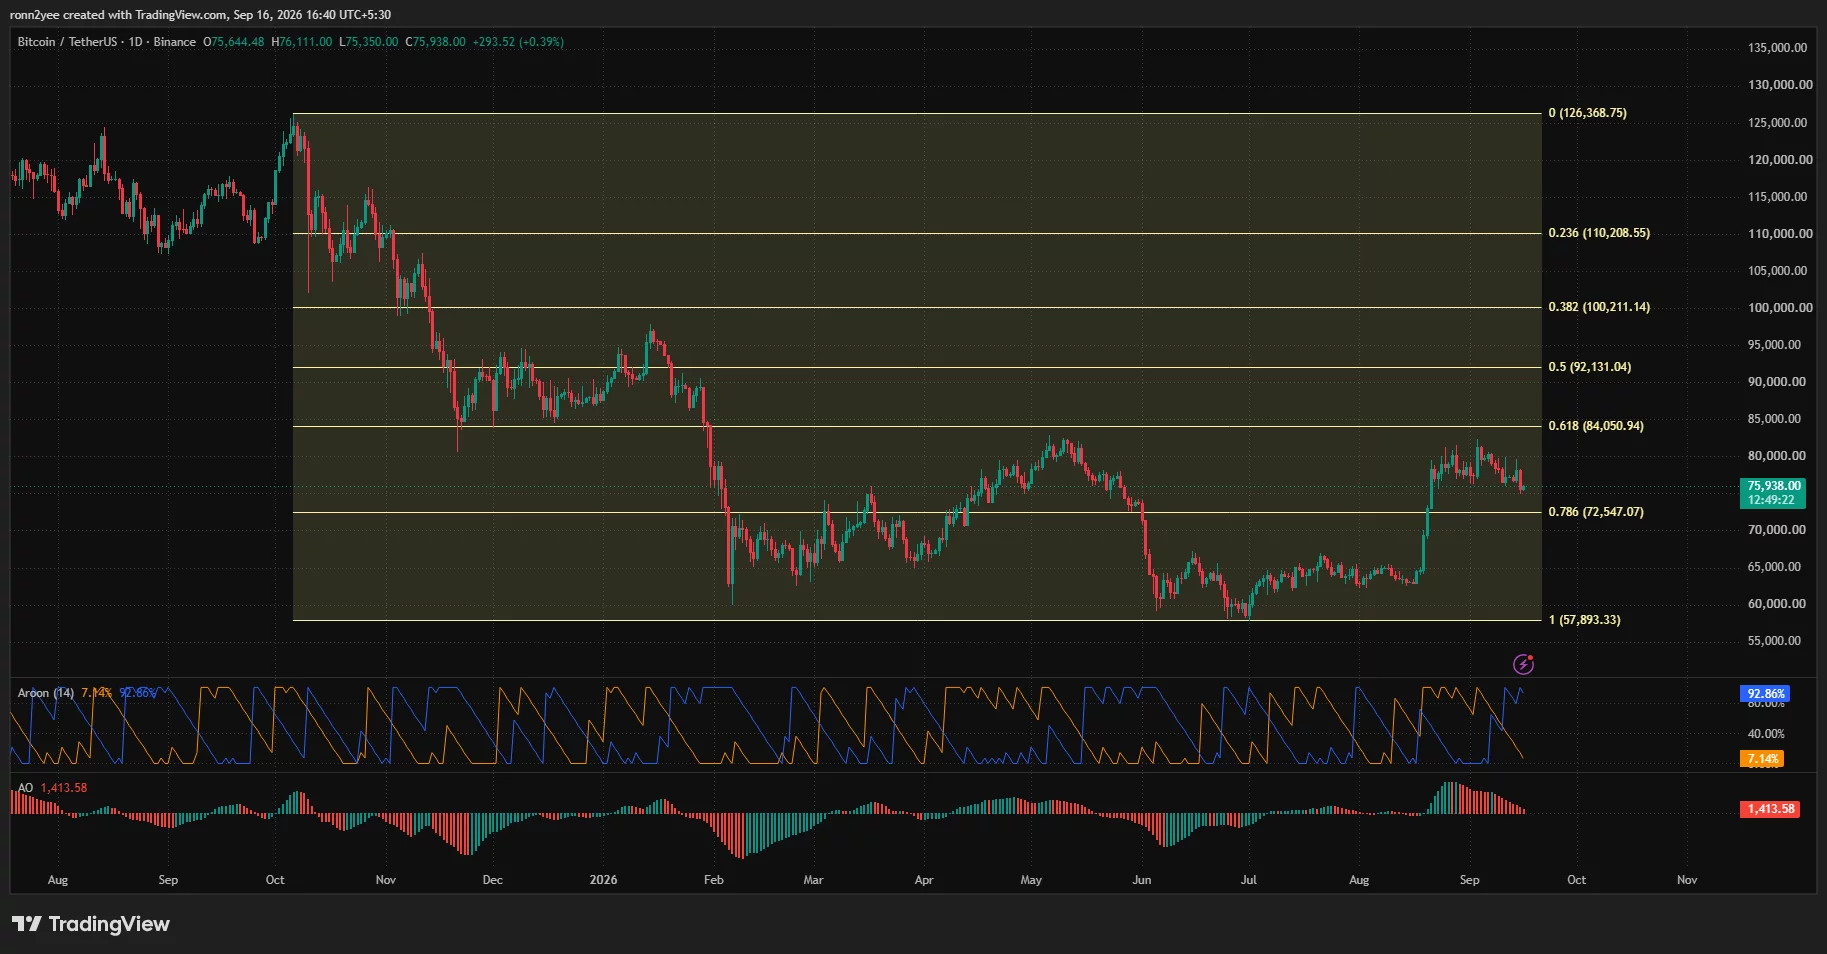
Bitcoin remains above the 78.6% Fibonacci retracement level at $72,547 on the daily chart. The retracement is measured between the broader low at $57,893 and the high near $126,369.
Bitcoin price daily chart — Sep. 16 | Source:
crypto.newsThe $72,547 level is the clearest major support below the current price. A drop from $75,940 to that zone would represent a decline of about 4.5%.
Daily momentum has already turned lower. The Aroon Down reading stood at 92.86%, compared with an Aroon Up reading of 7.14%. The wide gap indicates that recent lows are arriving much more frequently than recent highs.
The Awesome Oscillator also registered a negative reading of 1,413.58, with red histogram bars extending below zero. The indicator supports the bearish Aroon signal and shows that downside momentum remains dominant.
BTC has formed lower highs since its early September move above $81,000. The price would first need to recover the $78,000–$80,000 region before challenging the larger technical barrier around $83,000–$84,051.
The $84,051 level aligns with the 61.8% Fibonacci retracement and sits close to the $83,000 resistance identified by market analyst Gerla. In a Sep. 16 post, Gerla said the CLARITY Act reaction had removed weak positioning but argued that reclaiming $83,000 could open a move toward $100,000.
Gerla’s projection remains conditional because BTC currently trades roughly 8.5% below $83,000, while the daily indicators favor sellers.
Bitcoin liquidation map places liquidity on both sides
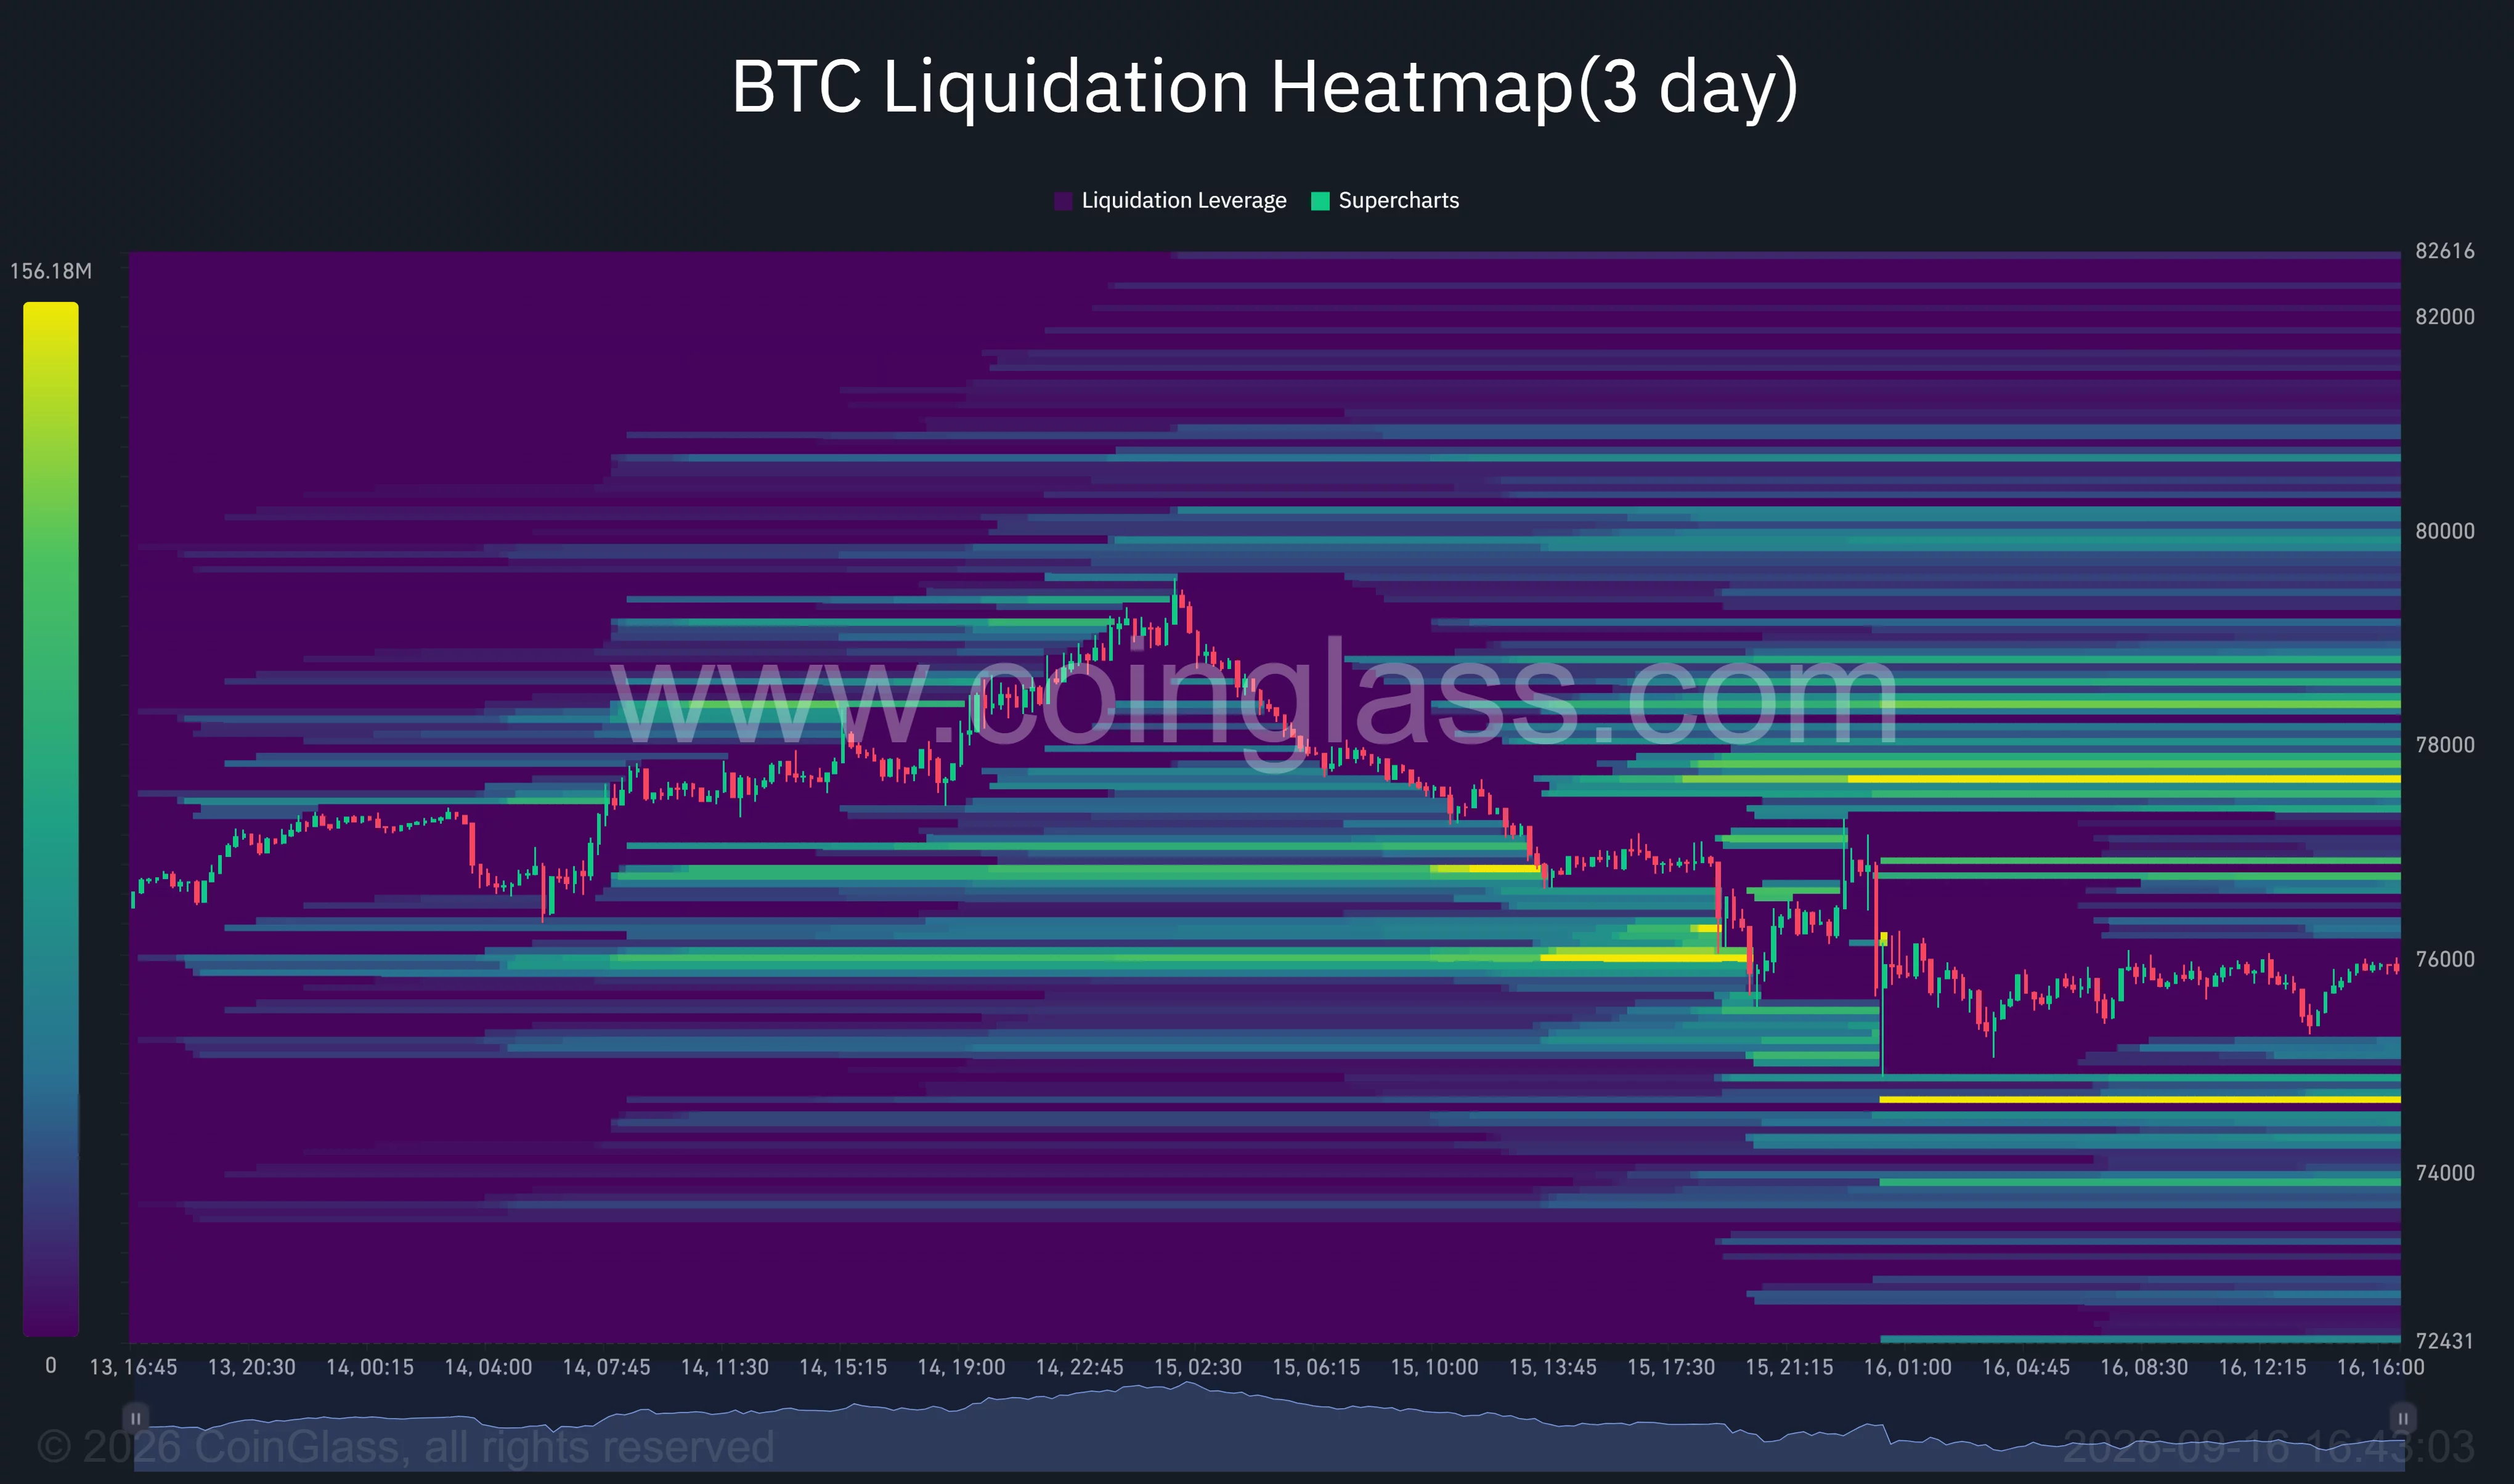
CoinGlass’s three-day Bitcoin liquidation heatmap shows concentrated leverage above and below the current price.
Bitcoin liquidation chart | Source:
CoinGlassThe strongest nearby downside pool appears around $74,700–$74,900. Additional liquidity is visible near $74,000, making the broader $74,000–$75,000 area a possible target if Bitcoin loses its latest low.
Larger upside concentrations sit near $77,700–$78,000 and around $78,300–$78,700. A recovery could draw BTC toward those areas as short positions become vulnerable to forced closure.
A separate band appears around $80,000, although Bitcoin must first overcome the 4-hour Bollinger midpoint and the nearer liquidation zones. Heatmaps identify areas where leveraged positions may be forced out, but they do not predict which level the market will approach first.
Federal Reserve decision could trigger another sweep
Trader Lennaert Snyder said Bitcoin swept the $75,500 low after the CLARITY Act vote produced the bearish reaction he had expected. Snyder said he was watching for consolidation before the Federal Open Market Committee announcement, followed by a possible second sweep of the lows.
The Federal Reserve’s Sep. 15–16 meeting adds event risk to an already fragile market. Rate decisions and accompanying guidance can affect Treasury yields, the dollar, and demand for risk assets, including Bitcoin.
For the bullish case, BTC must hold $75,000 and retake $77,080. A move above $78,918 would return the price to the upper part of its recent 4-hour range, while a break above $83,000 would change the broader structure.
The bearish case gains strength below $75,000. Such a move could pull Bitcoin toward the liquidation concentration near $74,800 before testing the daily Fibonacci support at $72,547.
Disclosure: This article does not represent investment advice. The content and materials featured on this page are for educational purposes only.
Read more: Ethiopia cuts power to Bitcoin miners as El Niño strains hydropower