BNB price prediction August 2026 comes into focus as BNB heads into the month sitting right at a fork that has been building for weeks, caught between two chart patterns approaching their dec
BNB price prediction August 2026 comes into focus as BNB heads into the month sitting right at a fork that has been building for weeks, caught between two chart patterns approaching their decision point at almost the same time.
The way this month opens could end up defining the next few, and BNB's price action right now is exactly why traders are paying closer attention than usual.
$BNB Price Today: Live Data and 24-Hour Change
Metric
Value
Price
$567.01
24h Change
-1.2% (-$6.8815)
Market Cap
$75.28B
Futures Volume (24h)
$523.71M
Spot Volume (24h)
$60.55M
Open Interest
$858.33M
Circulating / Total / Max Supply
133.16M BNB
Sourced from CoinGlass BNB market data alongside the live TradingView chart, captured July 29, 2026, 09:53 AM IST.
For a continuously updated read on where BNB stands right now, ourtoday's BNB price prediction tracks these numbers as they move.
On-Chain and Fundamental Drivers (BNB)
Beyond the chart, BNB's value is tied closely to activity across the Binance ecosystem, including exchange usage and the $BNB Chain itself, along with the network's periodic token burns that reduce circulating supply over time.
With supply already effectively capped near its current level, ongoing chain usage and burn activity remain the more relevant fundamental threads to watch through August rather than any single data point.
Investors weighing BNB's position further out may also want to see how these same drivers play into ourBNB price prediction 2027.
Daily Chart: Descending Trendline Breakout
A shorter-term version of this same signal shows up on the daily chart, where $BNB recently broke out of a descending trendline and is now consolidating inside a descending channel of its own.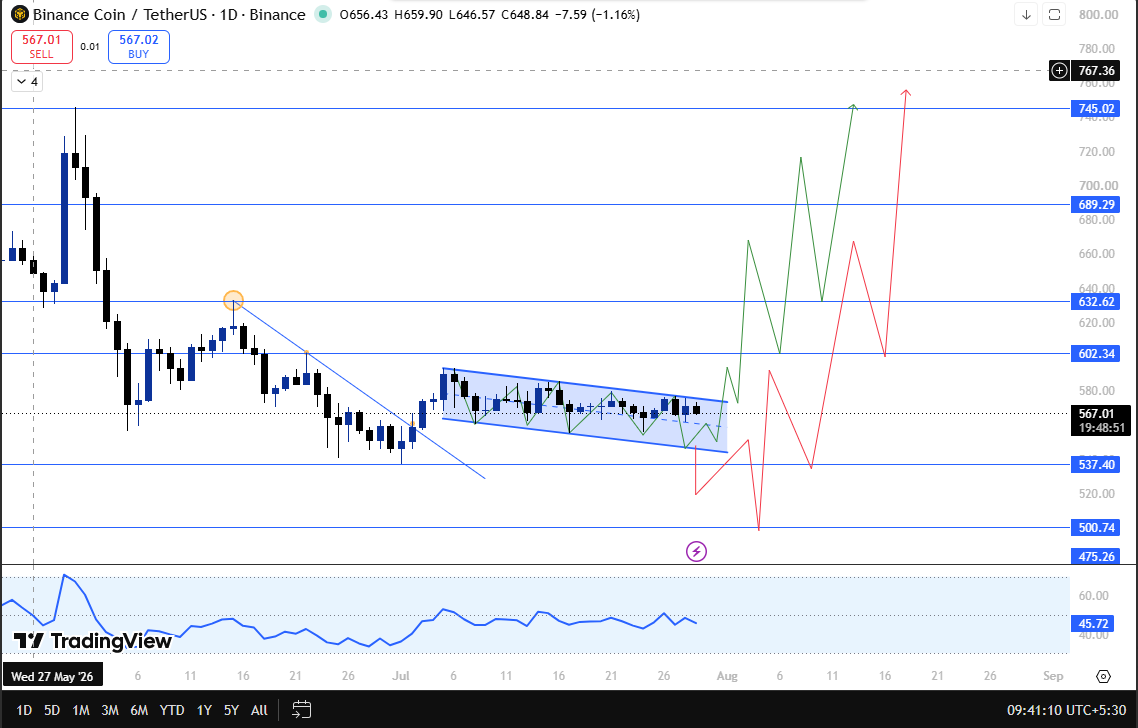
A close above $602.34 with volume on that timeframe points toward $632.62, then $689.29 as sequential targets, giving an earlier confirmation cue ahead of any weekly close.
Weekly Chart: Symmetrical Triangle Levels
The bull case rests on the weekly chart, where $BNB has been trading inside a symmetrical triangle since June.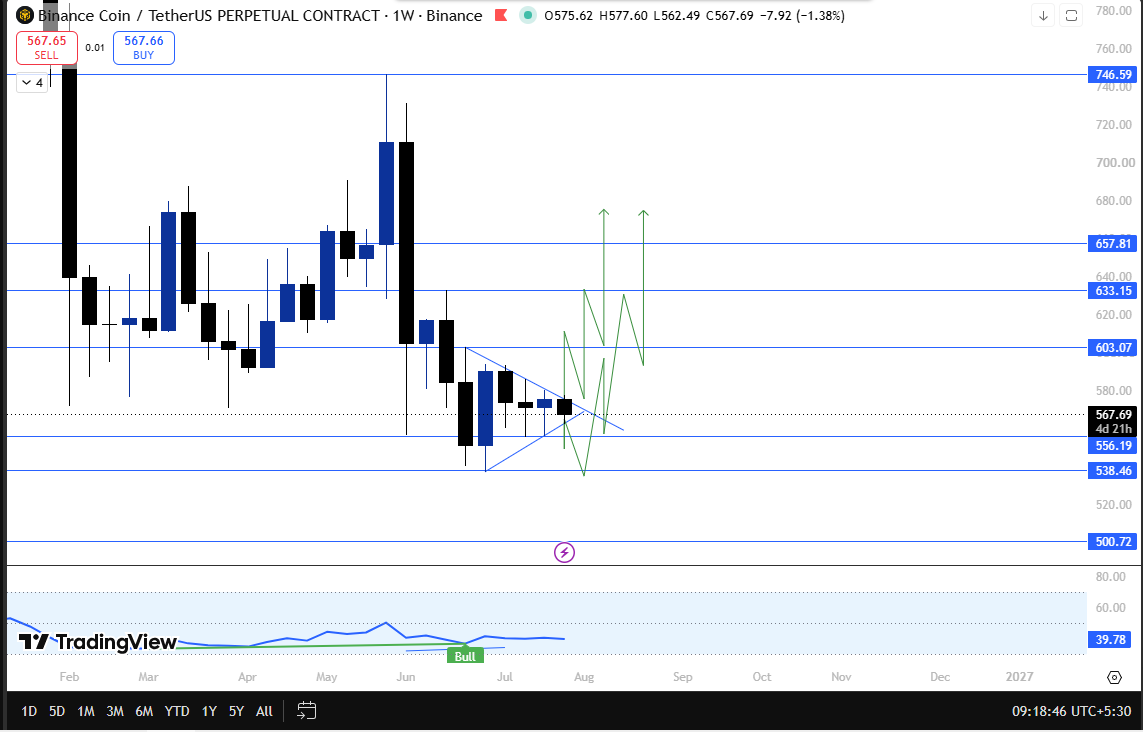
If the price closes above $603.07 with strong volume behind it, that would confirm a triangle breakout, and the first resistance target sits at $633.15, followed by $657.81 and a further stretch toward $746.59 if buyers stay in control through the month.
$BNB Price Prediction August 2026: Bull, Base and Bear Cases
For the broader year-long backdrop behind these numbers, see our fullBNB price prediction 2026.
Bull case: a confirmed weekly close above $603.07 on rising volume, opening room toward $633.15 and then $657.81, with $746.59 as a stretch target if August momentum holds
Base case: BNB continues consolidating between roughly $537 and $603, with no confirmed breakout either way for most of the month
Bear case: a confirmed weekly close below $556.19, or a daily close below $537.40 on volume, shifting focus down to the $500 psychological zone
Base Case: Range-Bound Consolidation
The base case, and arguably the more likely outcome for a good stretch of August, is continued price consolidation.
$BNB has spent weeks compressing between the triangle's boundaries on the weekly chart and inside the descending channel on the daily chart, and without a volume-driven breakout in either direction, that range-bound behavior could easily persist through much of the month.
Bear Case: Breakdown Risk
The bear case triggers on a confirmed weekly close below $556.19 or a daily close under $537.40 with real volume.
Either signals a failed breakout attempt and shifts the picture toward the $500 psychological level, which both timeframes flag as the zone where a recovery attempt becomes more likely.
Whether that level holds or not will say a lot about BNB's broader market structure heading into the rest of the quarter.
Technical Analysis: Key Support and Resistance Levels (BNB)
Timeframe
Trigger
Resistance Targets
Breakdown Trigger
Support Targets
Weekly
Close above $603.07
$633.15, $657.81, $746.59
Close below $556.19
$500.72
(psychological)
Daily
Close above $602.34
$632.62, $689.29, $745.02
Close below $537.40
$500.74 (psychological)
Across both timeframes, the closing price matters far more than a wick through either boundary.
A brief spike above $602 to $603 or below $537 to $556 that fails to hold by the candle's close does not confirm anything on its own, which is worth remembering given how tight this consolidation has become.
Risks That Could Invalidate This Forecast ($BNB)
This forecast holds only as long as BNB respects the ranges above.
A failed breakout above $602 to $603 that reverses back into the triangle would undercut the bull case, while a decisive break below $537 to $556 without a bounce at $500 would suggest deeper weakness than the base case assumes.
August also carries its usual event risk around broader crypto market sentiment, and a sharp move in Bitcoin or Ethereum could pull $BNB along with it regardless of where these specific levels sit.
Conclusion
The base case for August remains $BNB holding between roughly $537 and $603, with no confirmed breakout in either direction until one of those levels gives way on a closing basis.
This $BNB price prediction for August 2026 assumes the current range holds, and it is invalidated the moment $BNB closes decisively outside it, whether that is above $603.07 or below $556.19.
August 2026 carries its own event and volatility risk beyond these charts, so this analysis should be treated as one input for your own research, not financial advice.
For readers thinking beyond this year's range, ourBNB price prediction 2029 lays out where the longer cycle could head.
Disclaimer
This article is for informational purposes only and does not constitute financial advice. Cryptocurrency markets are highly volatile. Please verify current data independently and consult a licensed financial advisor before making any investment decisions.