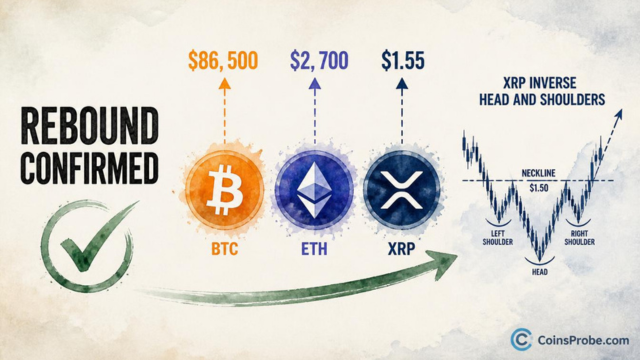
Key Highlights BTC at $82,725 targets $86,500 — analyst Ali Martinez (@alicharts) confirmed rebound after October 18 support call ETH bounced from $2,400 support to $2,512, with $2,700 as imm
Key Highlights
BTC at $82,725 targets $86,500 — analyst Ali Martinez (@alicharts) confirmed rebound after October 18 support call
ETH bounced from $2,400 support to $2,512, with $2,700 as immediate target and $3,100 as channel extension
XRP inverse head and shoulders neckline at $1.50 — $1.55 close confirms breakout toward $2.00 measured move
Martinez: "Break these levels, and the rally extends further" — all three gates must clear for continuation
Bitcoin is trading at $82,725 — down 0.12% in the last 24 hours — while Ethereum holds near $2,512 and XRP sits at $1.39. The moves follow a market-wide rebound that chart analyst Ali Martinez (@alicharts) called in advance, with three specific support zones now confirmed as the floor for the next leg.
On October 21, Martinez posted: “MARKET REBOUND AS PREDICTED! Immediate targets: $BTC: $86,500 / $ETH: $2,700 / $XRP: $1.55. Break these levels, and the rally extends further.” The call follows his October 18 thread — titled “BITCOIN, ETHEREUM, XRP COULD REBOUND… But only if these levels hold” — in which he identified the exact support zones that have since acted as the base for the current bounce.
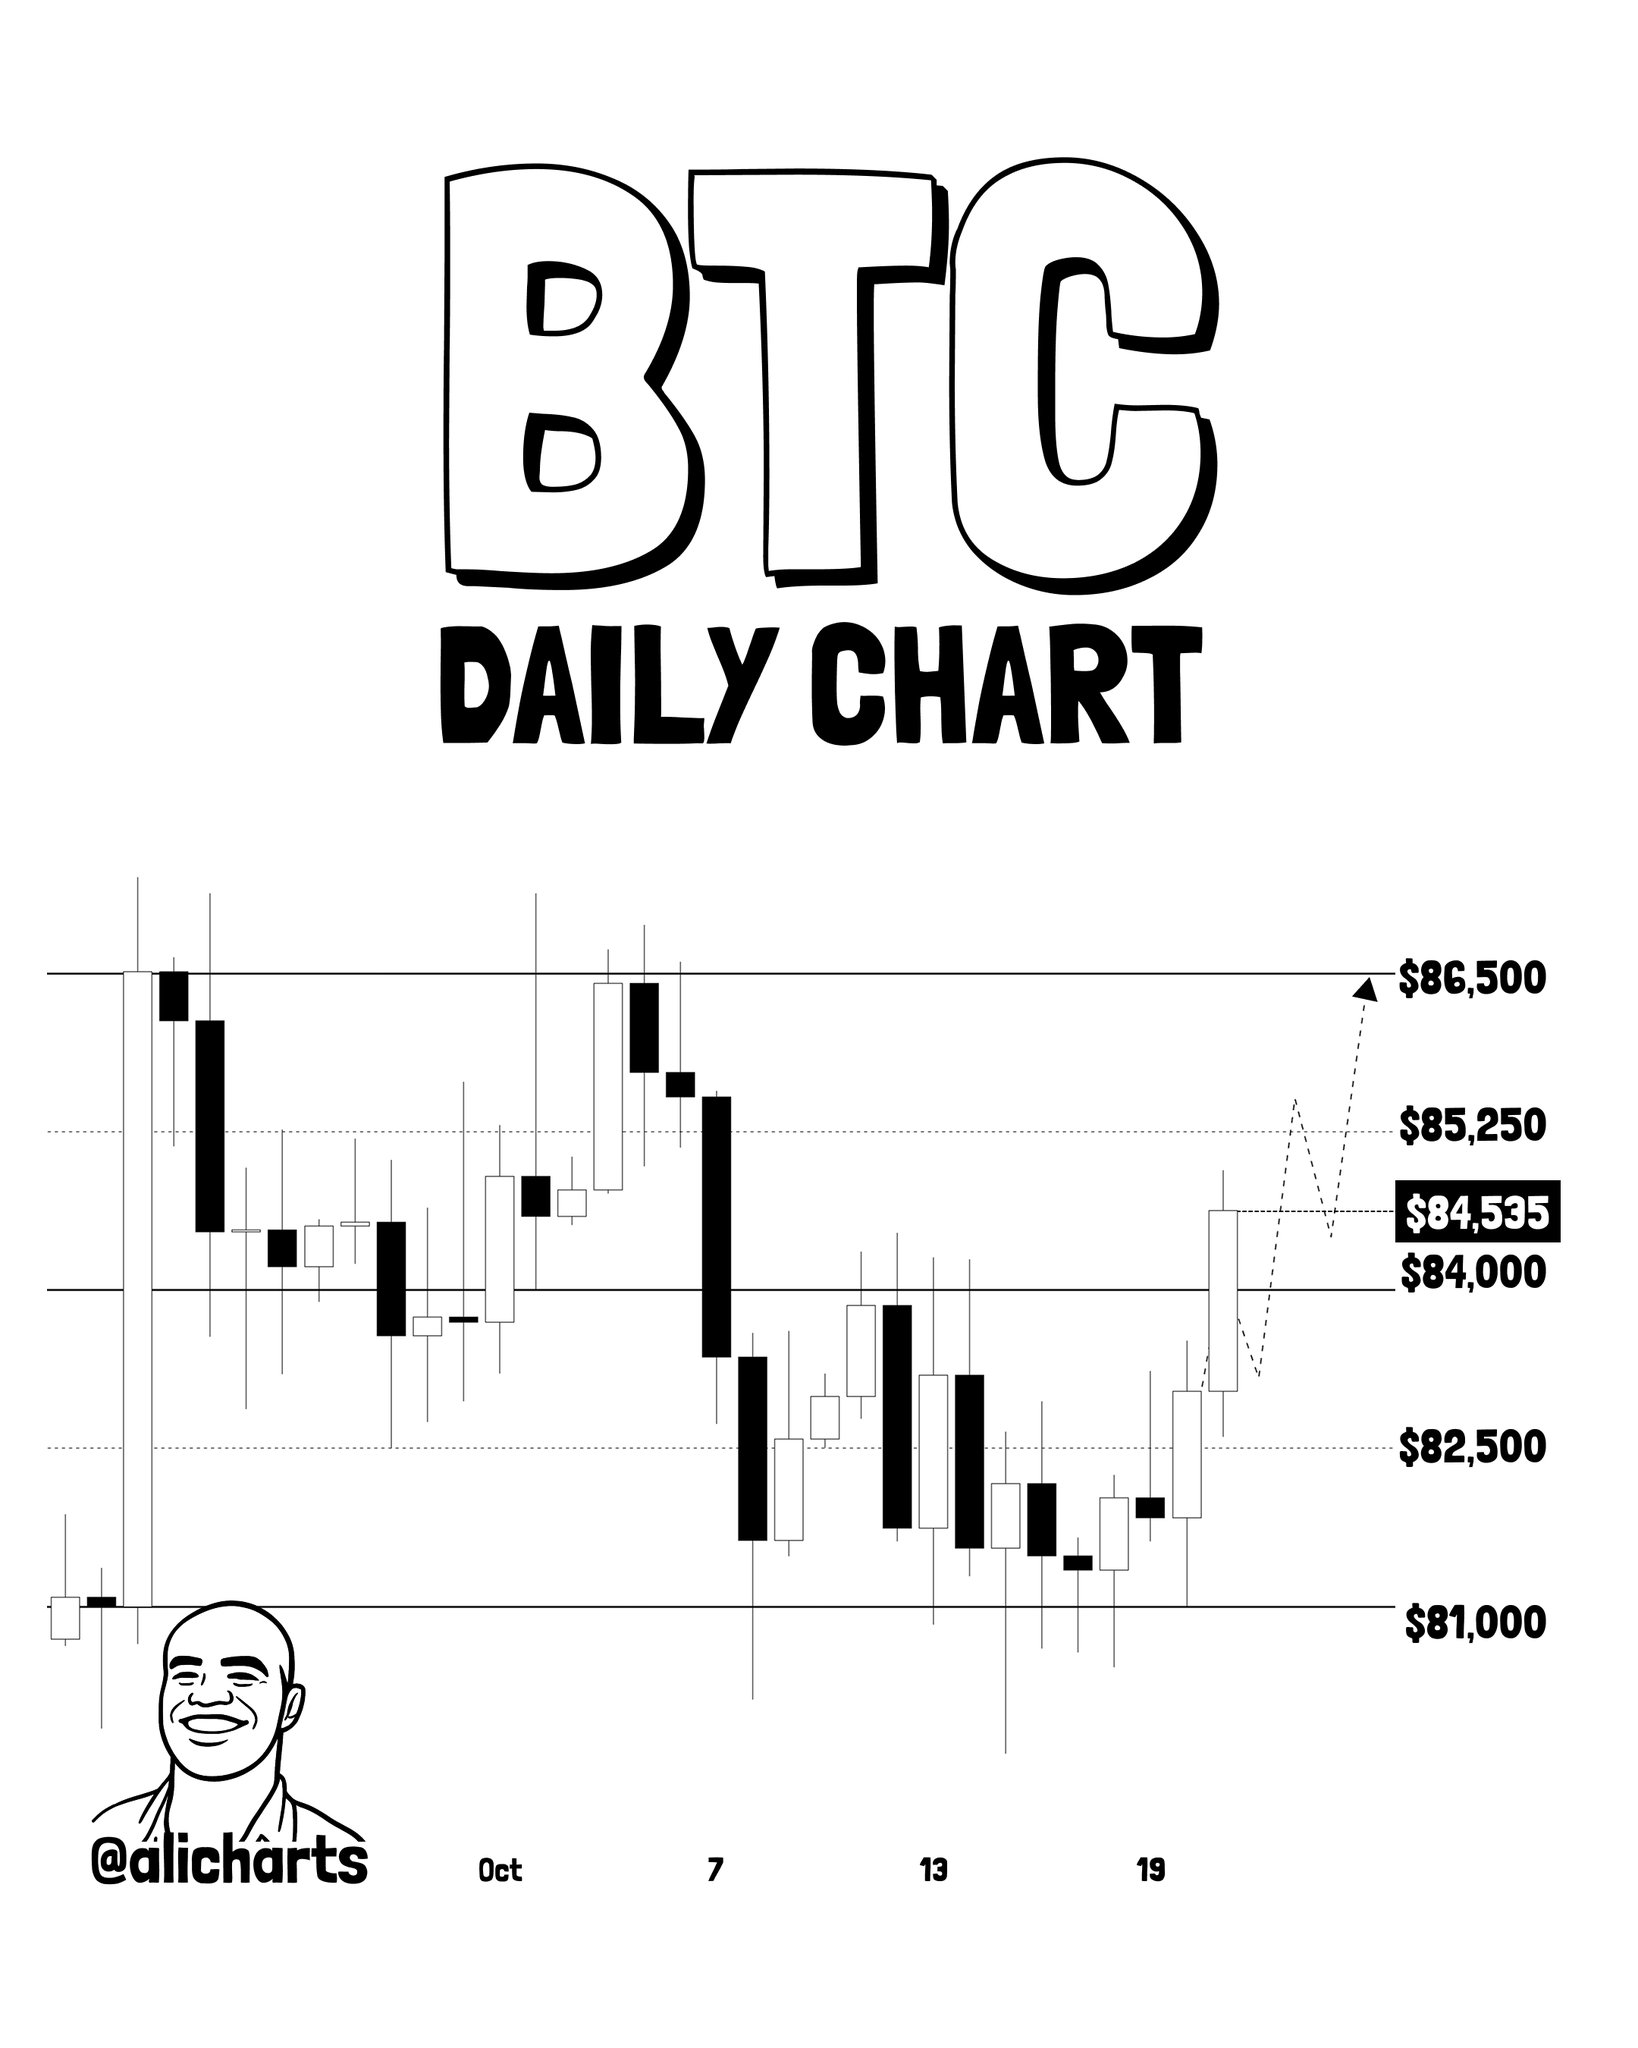
The daily BTC chart shared by @alicharts shows price declining from the upper-left of the chart through mid-October, hitting a sharp trough around October 13 before recovering. The current price had reclaimed the $84,000 level at the time of the chart, with a dashed projection line pointing directly at $86,500 — Martinez’s stated immediate target. The $84,000 line is marked as the pivotal support-turned-floor on the chart, and $86,500 is annotated as the next resistance the rally must clear.
BTC Daily Chart | Source: @alicharts (X)
At $82,725 at the time of writing, Bitcoin is still below the $84,000 level visible on the chart as the reclaim zone. The analyst’s condition is explicit: a sustained break above $86,500 is what extends the rally further. Until that level is cleared, the bounce remains a recovery within the prior range rather than a confirmed continuation. Intermediate price labels on the chart include $85,250, $84,535, $84,000, $82,500, and $81,000 — with $82,500 serving as the closest visible support below the current spot price.
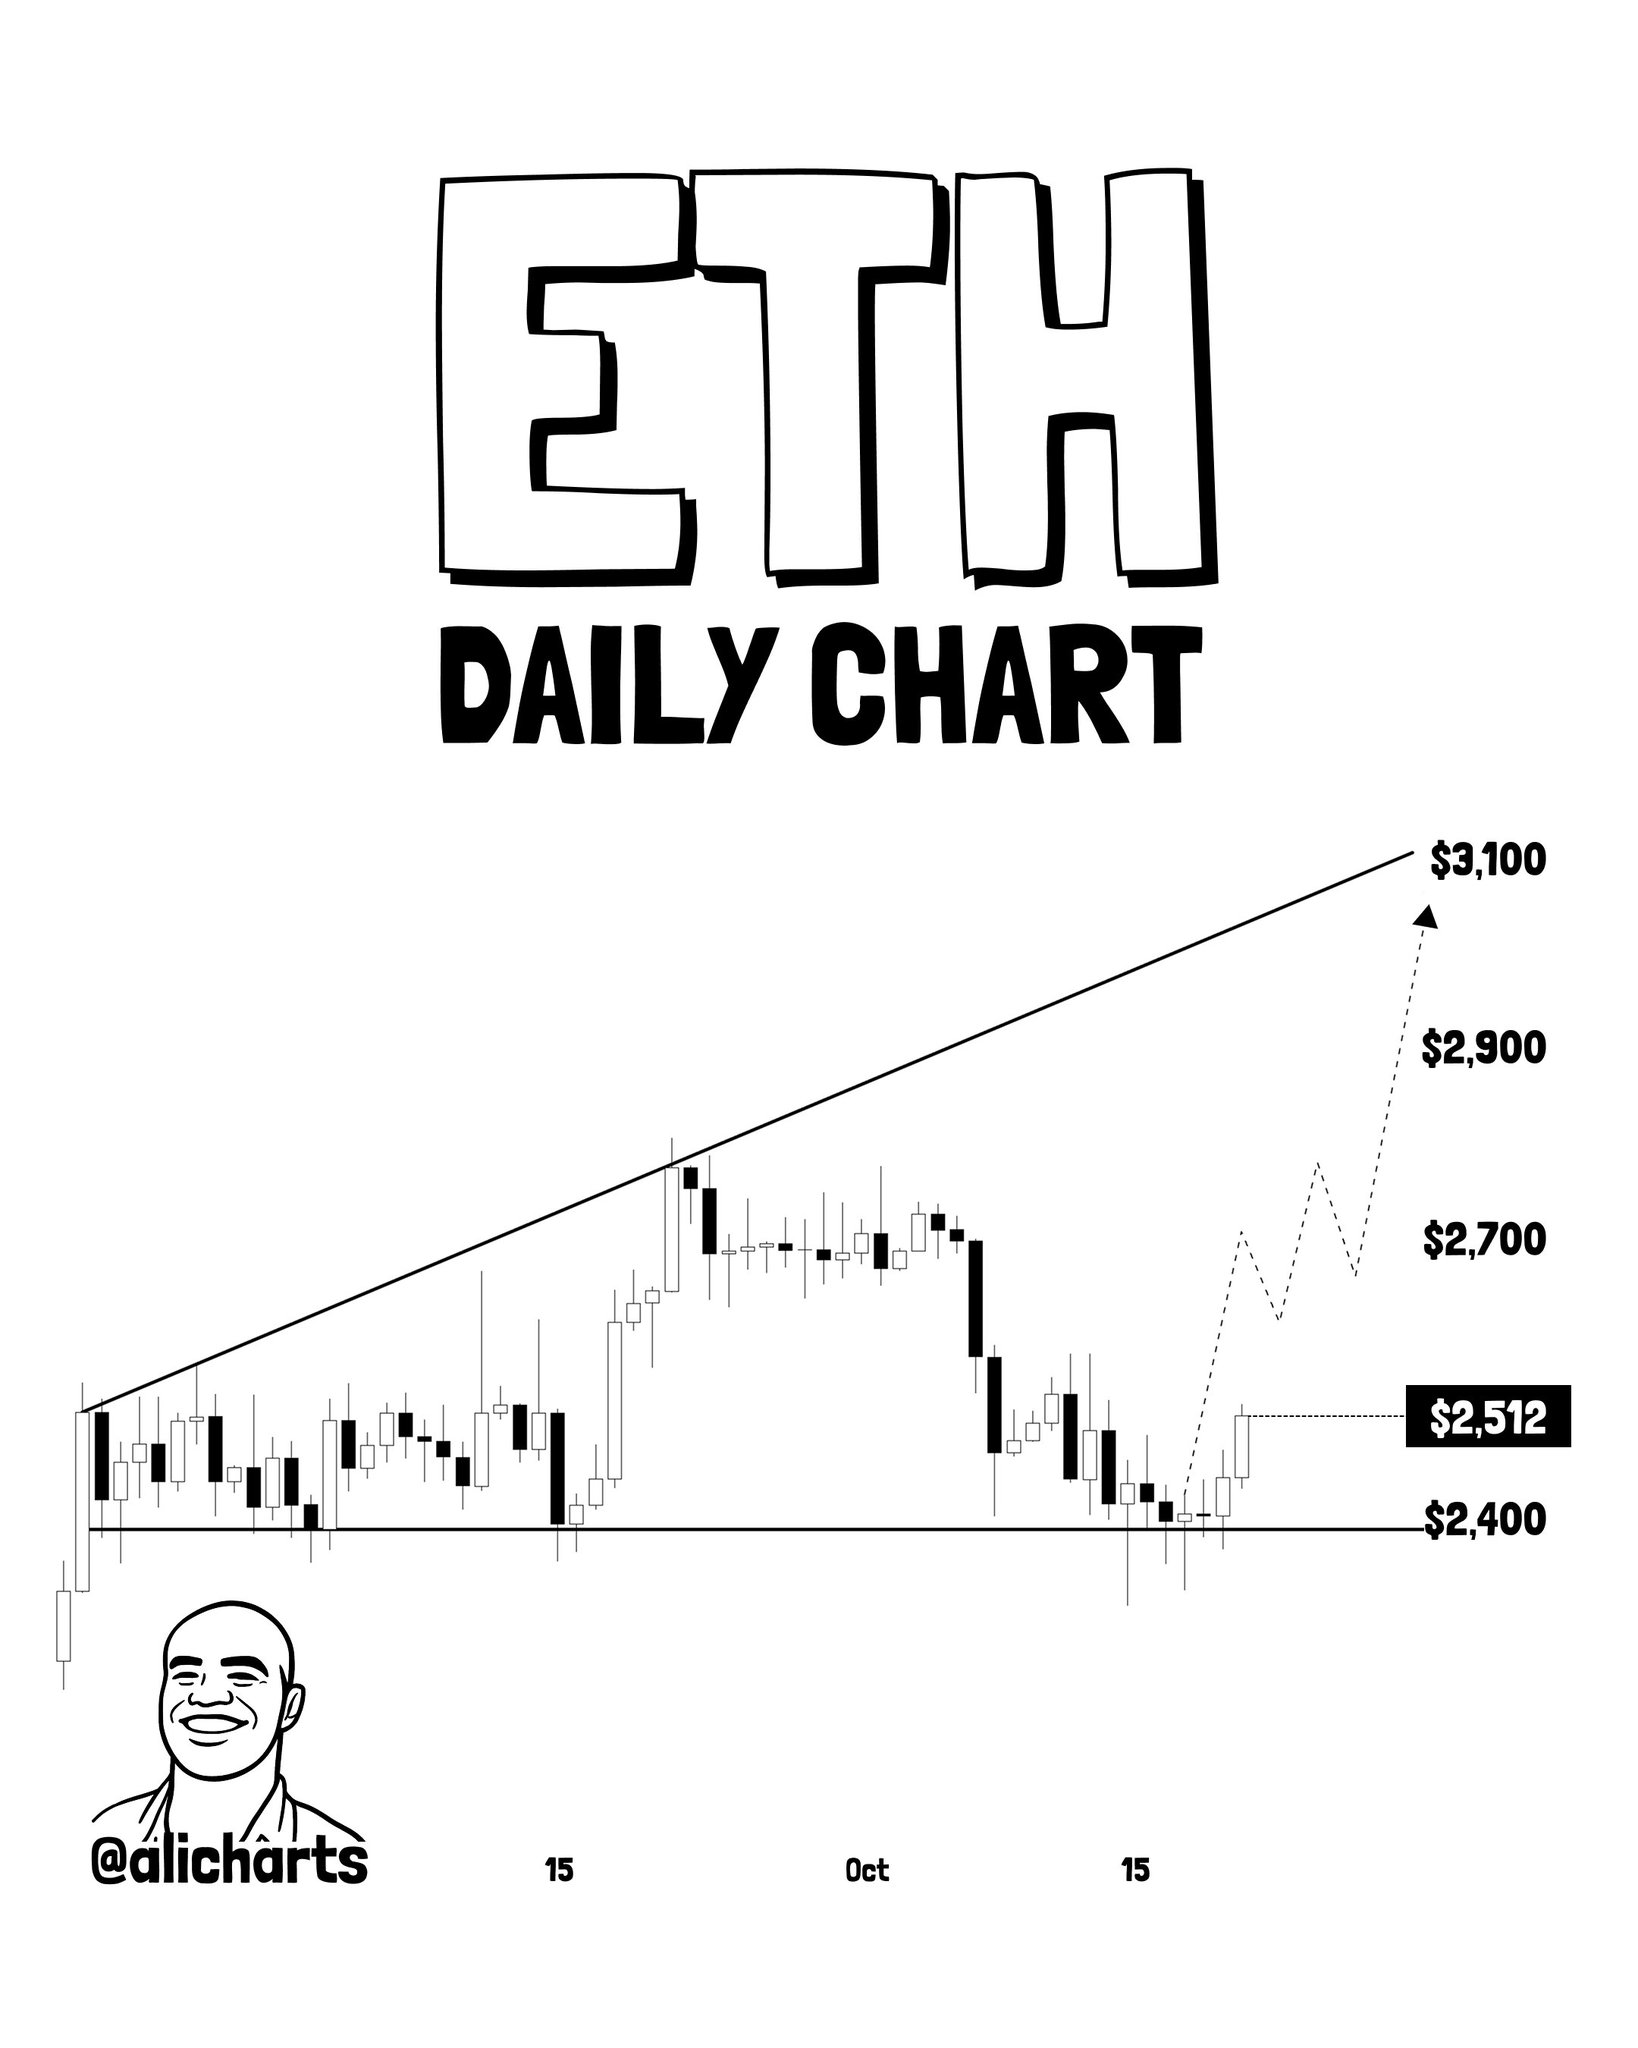
The ETH daily chart reveals an ascending channel or rising wedge structure, with price testing the lower boundary near $2,400 before the bounce that brought it to approximately $2,512 — marked with a black label on the chart. Martinez’s dashed projection traces a zigzag path upward: first toward $2,700, then continuing toward $3,100 in alignment with the upper diagonal trendline of the channel.
ETH Daily Chart | Source: @alicharts (X)
The $2,700 level is Martinez’s stated immediate target for Ethereum. It represents the first meaningful resistance within the channel structure before the upper trendline at approximately $3,100. The bounce from $2,400 support — the level Martinez flagged on October 18 as the key zone that must hold — is what triggered the updated target confirmation in his October 21 post.
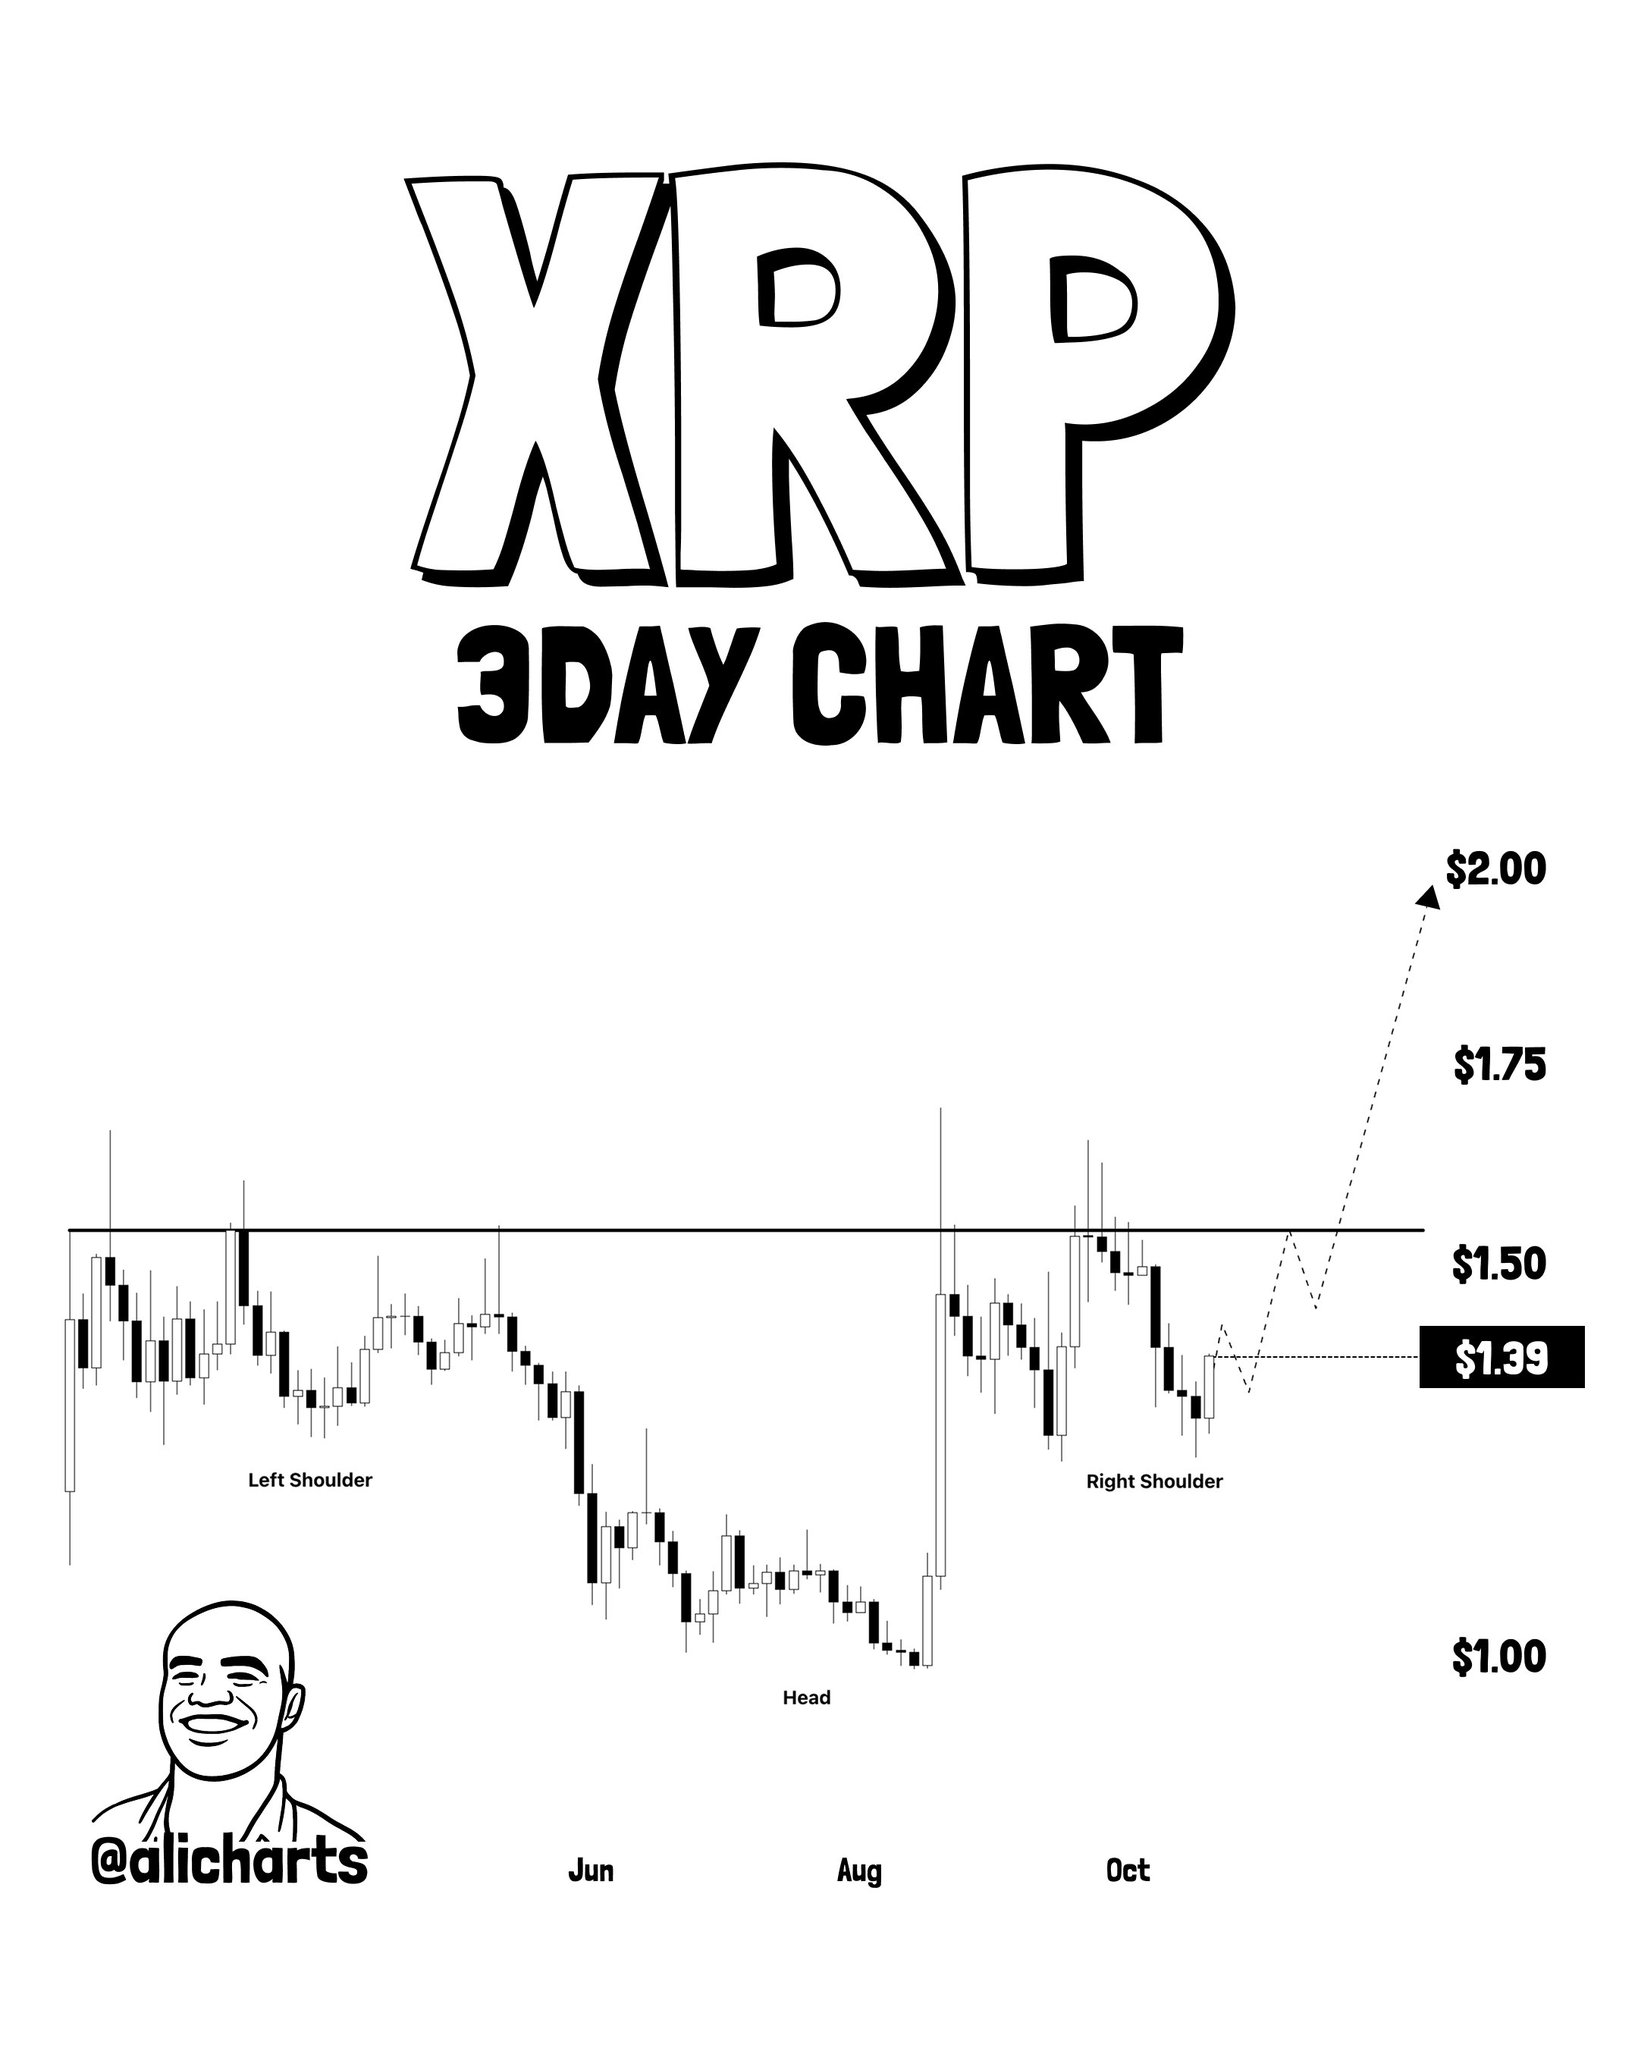
The XRP 3-day chart is the most structurally defined of the three. @alicharts annotates a completed inverse head and shoulders pattern, with the left shoulder, head (the deepest trough), and right shoulder all explicitly labeled. A horizontal neckline runs near $1.50. At the time of the chart, XRP was trading at $1.39 — just below neckline — with a dashed arrow projecting a breakout move toward $2.00.
XRP 3D Chart | Source: @alicharts (X)
Martinez’s stated immediate target of $1.55 for XRP is a neckline breakout confirmation level — sitting just above the $1.50 neckline drawn on the chart. The analyst’s logic: a sustained move above $1.55 confirms the inverse H&S breakout is live, opening the path to the $2.00 measured move target visible on the chart. Note the distinction: the chart’s neckline is drawn at $1.50, while the analyst explicitly states $1.55 as the level that confirms the break. Both figures refer to the same structural zone — $1.50 is the visual pattern boundary, $1.55 is his stated confirmation trigger.
Martinez’s framework across all three assets is identical in structure: the support levels held (as predicted October 18), the immediate bounce is now live, but the rally’s extension depends on breaking specific resistance levels — not merely bouncing from support. For Bitcoin that gate is $86,500. For Ethereum it is $2,700. For XRP it is $1.55. A failure to clear any of these levels converts the current move from a confirmed rally into a relief bounce within a broader downtrend.
This conditional structure matters. It is not a blanket all-clear signal — it is a staged thesis with explicit checkpoints. Traders watching this setup from a technical breakout perspective will recognize the pattern: support holds, bounce initiates, resistance becomes the next binary. Similar conditional setups have appeared across altcoins recently, including PENGU’s SuperTrend signals where each prior buy trigger required a specific confirmation level to validate the thesis.
Bullish Scenario
BTC closes above $86,500 with ETH simultaneously clearing $2,700 and XRP printing a daily close above $1.55. All three breaking their gates in sequence would confirm coordinated market-wide continuation, with XRP’s measured move pointing to $2.00 and ETH’s channel projecting toward $3,100 as extended targets per the chart annotations.
Bearish Scenario
Bitcoin fails to reclaim $84,000 on a sustained basis and rolls back below $82,500 — the nearest visible support on the daily chart. For XRP, a failure to break $1.55 and a drop back below the $1.39 right shoulder level would invalidate the inverse head and shoulders setup. For ETH, a loss of the $2,400 lower channel boundary reopens the $2,000 zone.
The rebound Martinez predicted on October 18 has materialized across Bitcoin, Ethereum, and XRP. The immediate targets — $86,500, $2,700, and $1.55 respectively — are not open-ended projections. They are the specific levels his analysis designates as rally-extension confirmations. Bitcoin at $82,725 remains the furthest from its gate. Watch $86,500 in BTC as the single level that determines whether this is a confirmed breakout or a bounce that exhausted itself before the next resistance.
Disclaimer: The views and analysis presented in this article are for informational purposes only and reflect the author’s perspective, not financial advice. Technical patterns and indicators discussed are subject to market volatility and may or may not yield anticipated results. Investors are advised to exercise caution, conduct independent research, and make decisions aligned with their individual risk tolerance.
Also Read: PENGU Prints Another SuperTrend Buy Signal — 3-for-3 Track Record