


Can Onyxcoin (XCN) Push Past Resistance or Face a Reversal?
 FLOW
FLOW
 XCN
XCN
 RES
RES
 CVG
CVG
 DIVER
DIVER
- Onyxcoin is trading at the $0.02218 level.
- XCN’s daily trading volume has decreased by over 61%.
The crypto market cap, resting at $3.19 trillion, has yet to fully bounce back from the recent downturn. Among altcoins, Onyxcoin (XCN) has been stuck in a sliding phase, reversing its recent gains, losing a modest 1.95%.
Despite attempting a breakout rally, XCN faces challenges in ensuring a strong recovery. The asset is trading below the key resistance level of $0.02230. Until this resistance is breached, the altcoin could continue the downside correction.
In the early hours, the altcoin broke through a crucial resistance level, and Onyxcoin visited the $0.02373 level and gradually, dropped toward $0.02167. At the time of writing, XCN traded at $0.02218 with the daily trading volume touching $71.72 million.
Over the past seven days, XCN has lost over 10.30%. The asset began the week trading at $0.02484, and it slipped toward the weekly low around the $0.01898 range.
Will XCN Reverse Its Downtrend?
A failure to breach the $0.02236 resistance might push to see more downside correction. An extended loss could prolong the negative trajectory. If the Onyxcoin price can’t hold above this mark, the asset may plummet toward $0.02152, making the recovery difficult.
However, assuming XCN breaks the $0.02249 resistance and flips it to a support, bring in a recovery. This would open the door to climb toward the $0.023 range, nullifying the bearish outlook. A successful breakout of the asset could potentially extend the bullish momentum.
Onyxcoin’s four-hour technical analysis reports the Moving Average Convergence Divergence (MACD) line below the signal line. It indicates the bearish momentum and the asset may continue to decline unless a reversal occurs. Traders often interpret this as a sell signal.
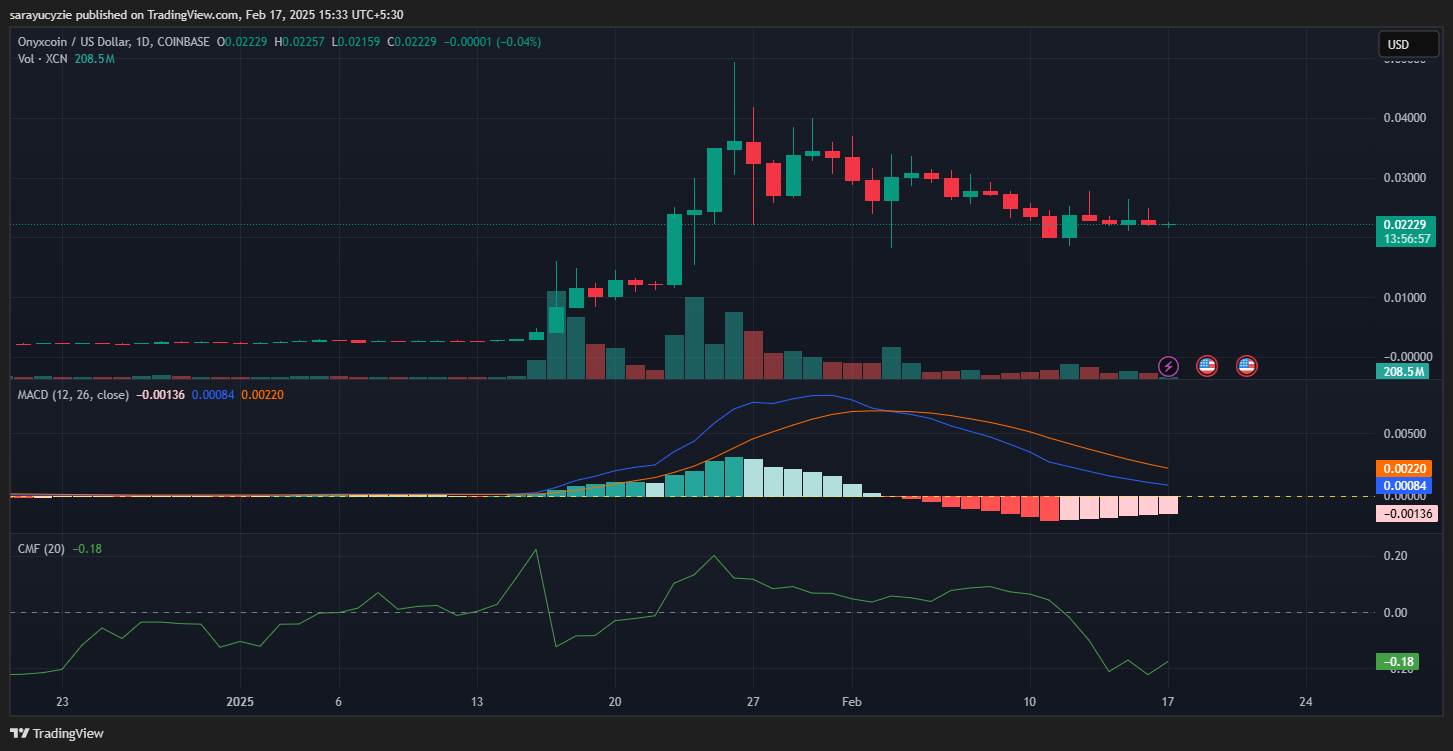
The Chaikin Money Flow (CMF) indicator at -0.18 suggests selling pressure, that the money is flowing out of the asset. Values below zero signal bearish sentiment in the market. Meanwhile, Onyxcoin’s daily trading volume has plunged by over 61.62%.
Moreover, the 24-hour trading chart exhibits the Bull Bear Power (BBP) value at -0.00359 indicating that bears have control over the market. The daily relative strength index (RSI) of Onyxcoin at 48.78 infers neither overbought nor oversold conditions, having a balanced market.
Disclaimer: The opinion expressed in this article is solely the author’s. It does not represent any investment advice. TheNewsCrypto team encourages all to do their own research before investing.
Highlighted Crypto News
Cynthia Lummis Backs a Bitcoin Reserve for the US, Citing 24/7 Auditability
