Chainlink price traded near $11.41 after failing to hold its latest rebound, while weak momentum and liquidity below $11.20 raised the risk of another decline. Summary Chainlink price remaine
Chainlink price traded near $11.41 after failing to hold its latest rebound, while weak momentum and liquidity below $11.20 raised the risk of another decline.
Summary
- Chainlink price remained below the $11.72 resistance after retreating from its September peak near $13.60.
- Daily Aroon readings showed fading upward momentum, with Aroon Up falling to 7.14%.
- 4-hour Bollinger Bands placed immediate support near $11.20 and resistance around $11.68.
- Liquidation clusters near $11.00 could draw the price lower if the current support range fails.
Chainlink price remains under pressure
Chainlink (LINK) price was trading around $11.41 at the time of writing, down 0.91% on the daily candle after moving between $11.30 and $11.63. The token remained close to the lower end of its intraday range as buyers struggled to extend a brief recovery.
LINK has lost much of the advance that carried it from approximately $8.20 in early August to a September high near $13.60. The rally accelerated after the price broke through $9.40 and later cleared $11.00, but selling increased once the token moved above $13.00.
Price has since formed a sequence of lower highs and lower lows. The latest bounce stalled below $11.70, leaving LINK beneath the $11.72 Murrey Math resistance level on the daily chart.
You might also like: Chainlink whale sends $7.6m in LINK to Coinbase
The broader crypto market also faced pressure as investors assessed inflation, energy prices and the outlook for U.S. interest rates. Expectations that the Federal Reserve could keep borrowing costs restrictive reduced demand for higher-risk assets, including cryptocurrencies that do not offer a fixed yield.
Uncertainty surrounding the Digital Asset Market Clarity Act added another U.S.-specific risk for crypto traders. A delayed or unsuccessful Senate vote could weaken expectations for near-term regulatory clarity, although LINK’s immediate move remained closely tied to its technical setup and wider market direction.
Daily indicators show fading LINK momentum
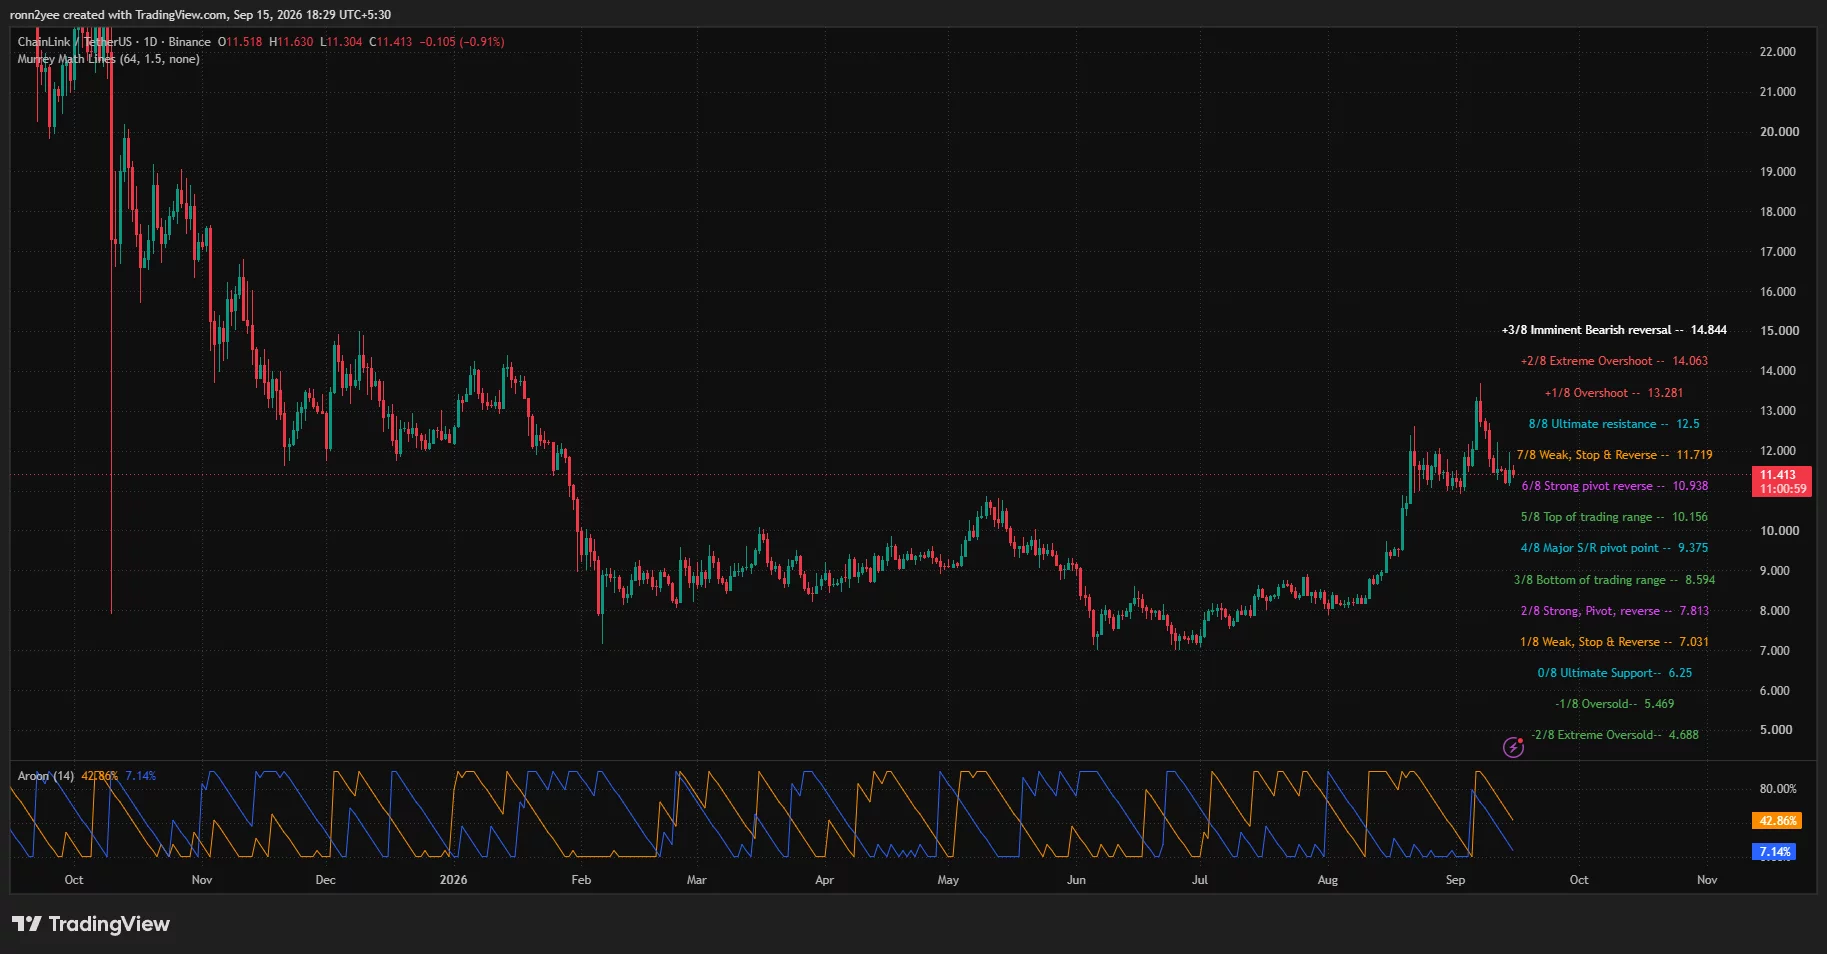
The daily chart showed LINK holding above the 6/8 Murrey Math level at $10.94, which now serves as the nearest major pivot. Price previously used the area around $11.00 as a breakout level during its August rally, making the zone important for the short-term trend.
Chainlink price daily chart — Sep. 15 | Source:
crypto.newsAroon readings pointed to weakening bullish control. Aroon Up stood at 7.14%, while Aroon Down was at 42.86%. The wide gap suggests that LINK has not recorded a recent high, while downside pressure remains more active.
The readings do not confirm a fresh breakdown on their own, but they support the pattern of declining momentum since the early September peak. Buyers would need to reclaim $11.72 before LINK could attempt another move toward the 8/8 resistance at $12.50.
A break above $12.50 would expose the next Murrey Math targets at $13.28 and $14.06. LINK would still need stronger volume and broader market support to reach those levels, particularly after its rejection from the $13.00–$13.60 region.
If $10.94 fails, the daily chart places the next support at $10.16. A deeper correction could then bring the major $9.38 pivot into focus, although such a move would require a clear loss of the current $11.00 support area.
4-hour chart keeps $11.20 support in focus
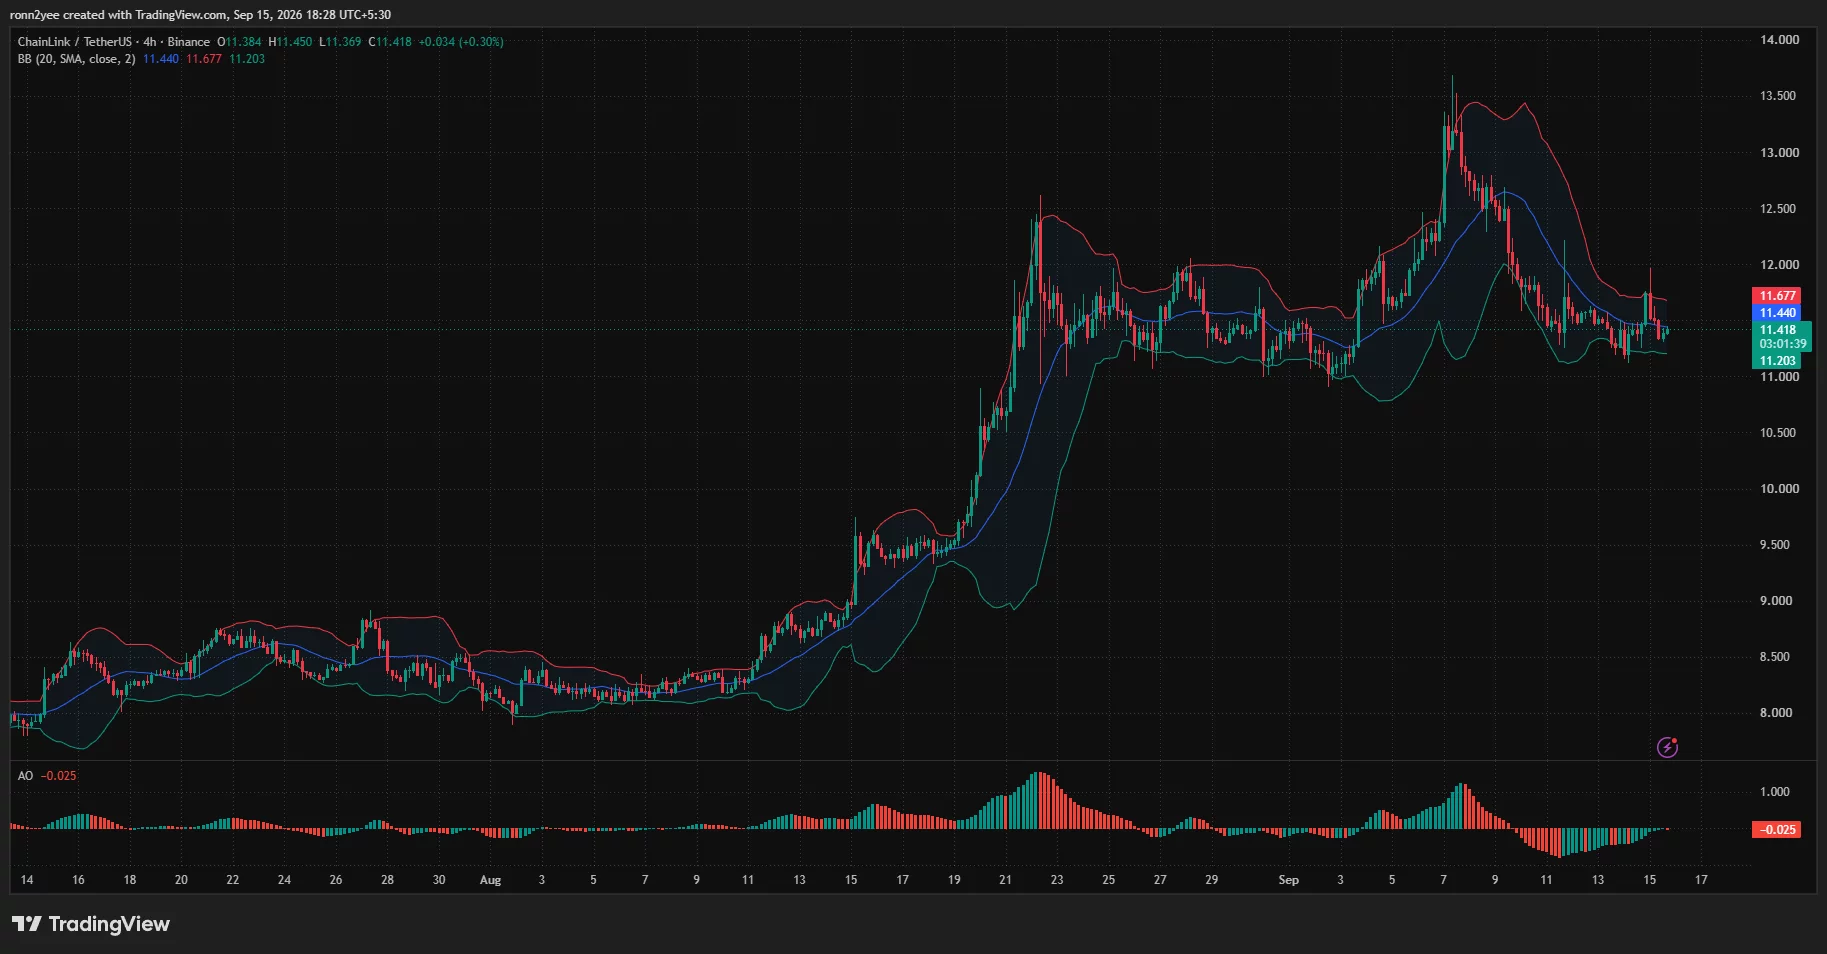
LINK was trading slightly below the 4-hour Bollinger Band midpoint at $11.44. The upper band stood near $11.68, while the lower band was around $11.20.
Chainlink price 4-hour chart — Sep. 15 | Source:
crypto.newsThe narrow distance between the bands reflected reduced volatility following the sharp decline from the September high. Price has moved sideways between roughly $11.20 and $11.70, creating a short-term consolidation range.
A close above the Bollinger midpoint would be an early sign that buyers are regaining control. LINK would then need to break $11.68–$11.72 to challenge the psychological $12.00 level.
The Awesome Oscillator remained marginally negative at -0.025. Its red bars had shortened, indicating that bearish momentum was easing, but the indicator had not yet moved decisively above zero to confirm a bullish shift.
Failure to defend the lower Bollinger Band could send LINK toward the daily pivot at $10.94. Conversely, a breakout above the upper band would weaken the short-term bearish structure and increase the chance of a recovery toward $12.00 and $12.50.
Liquidation map points to liquidity near $11
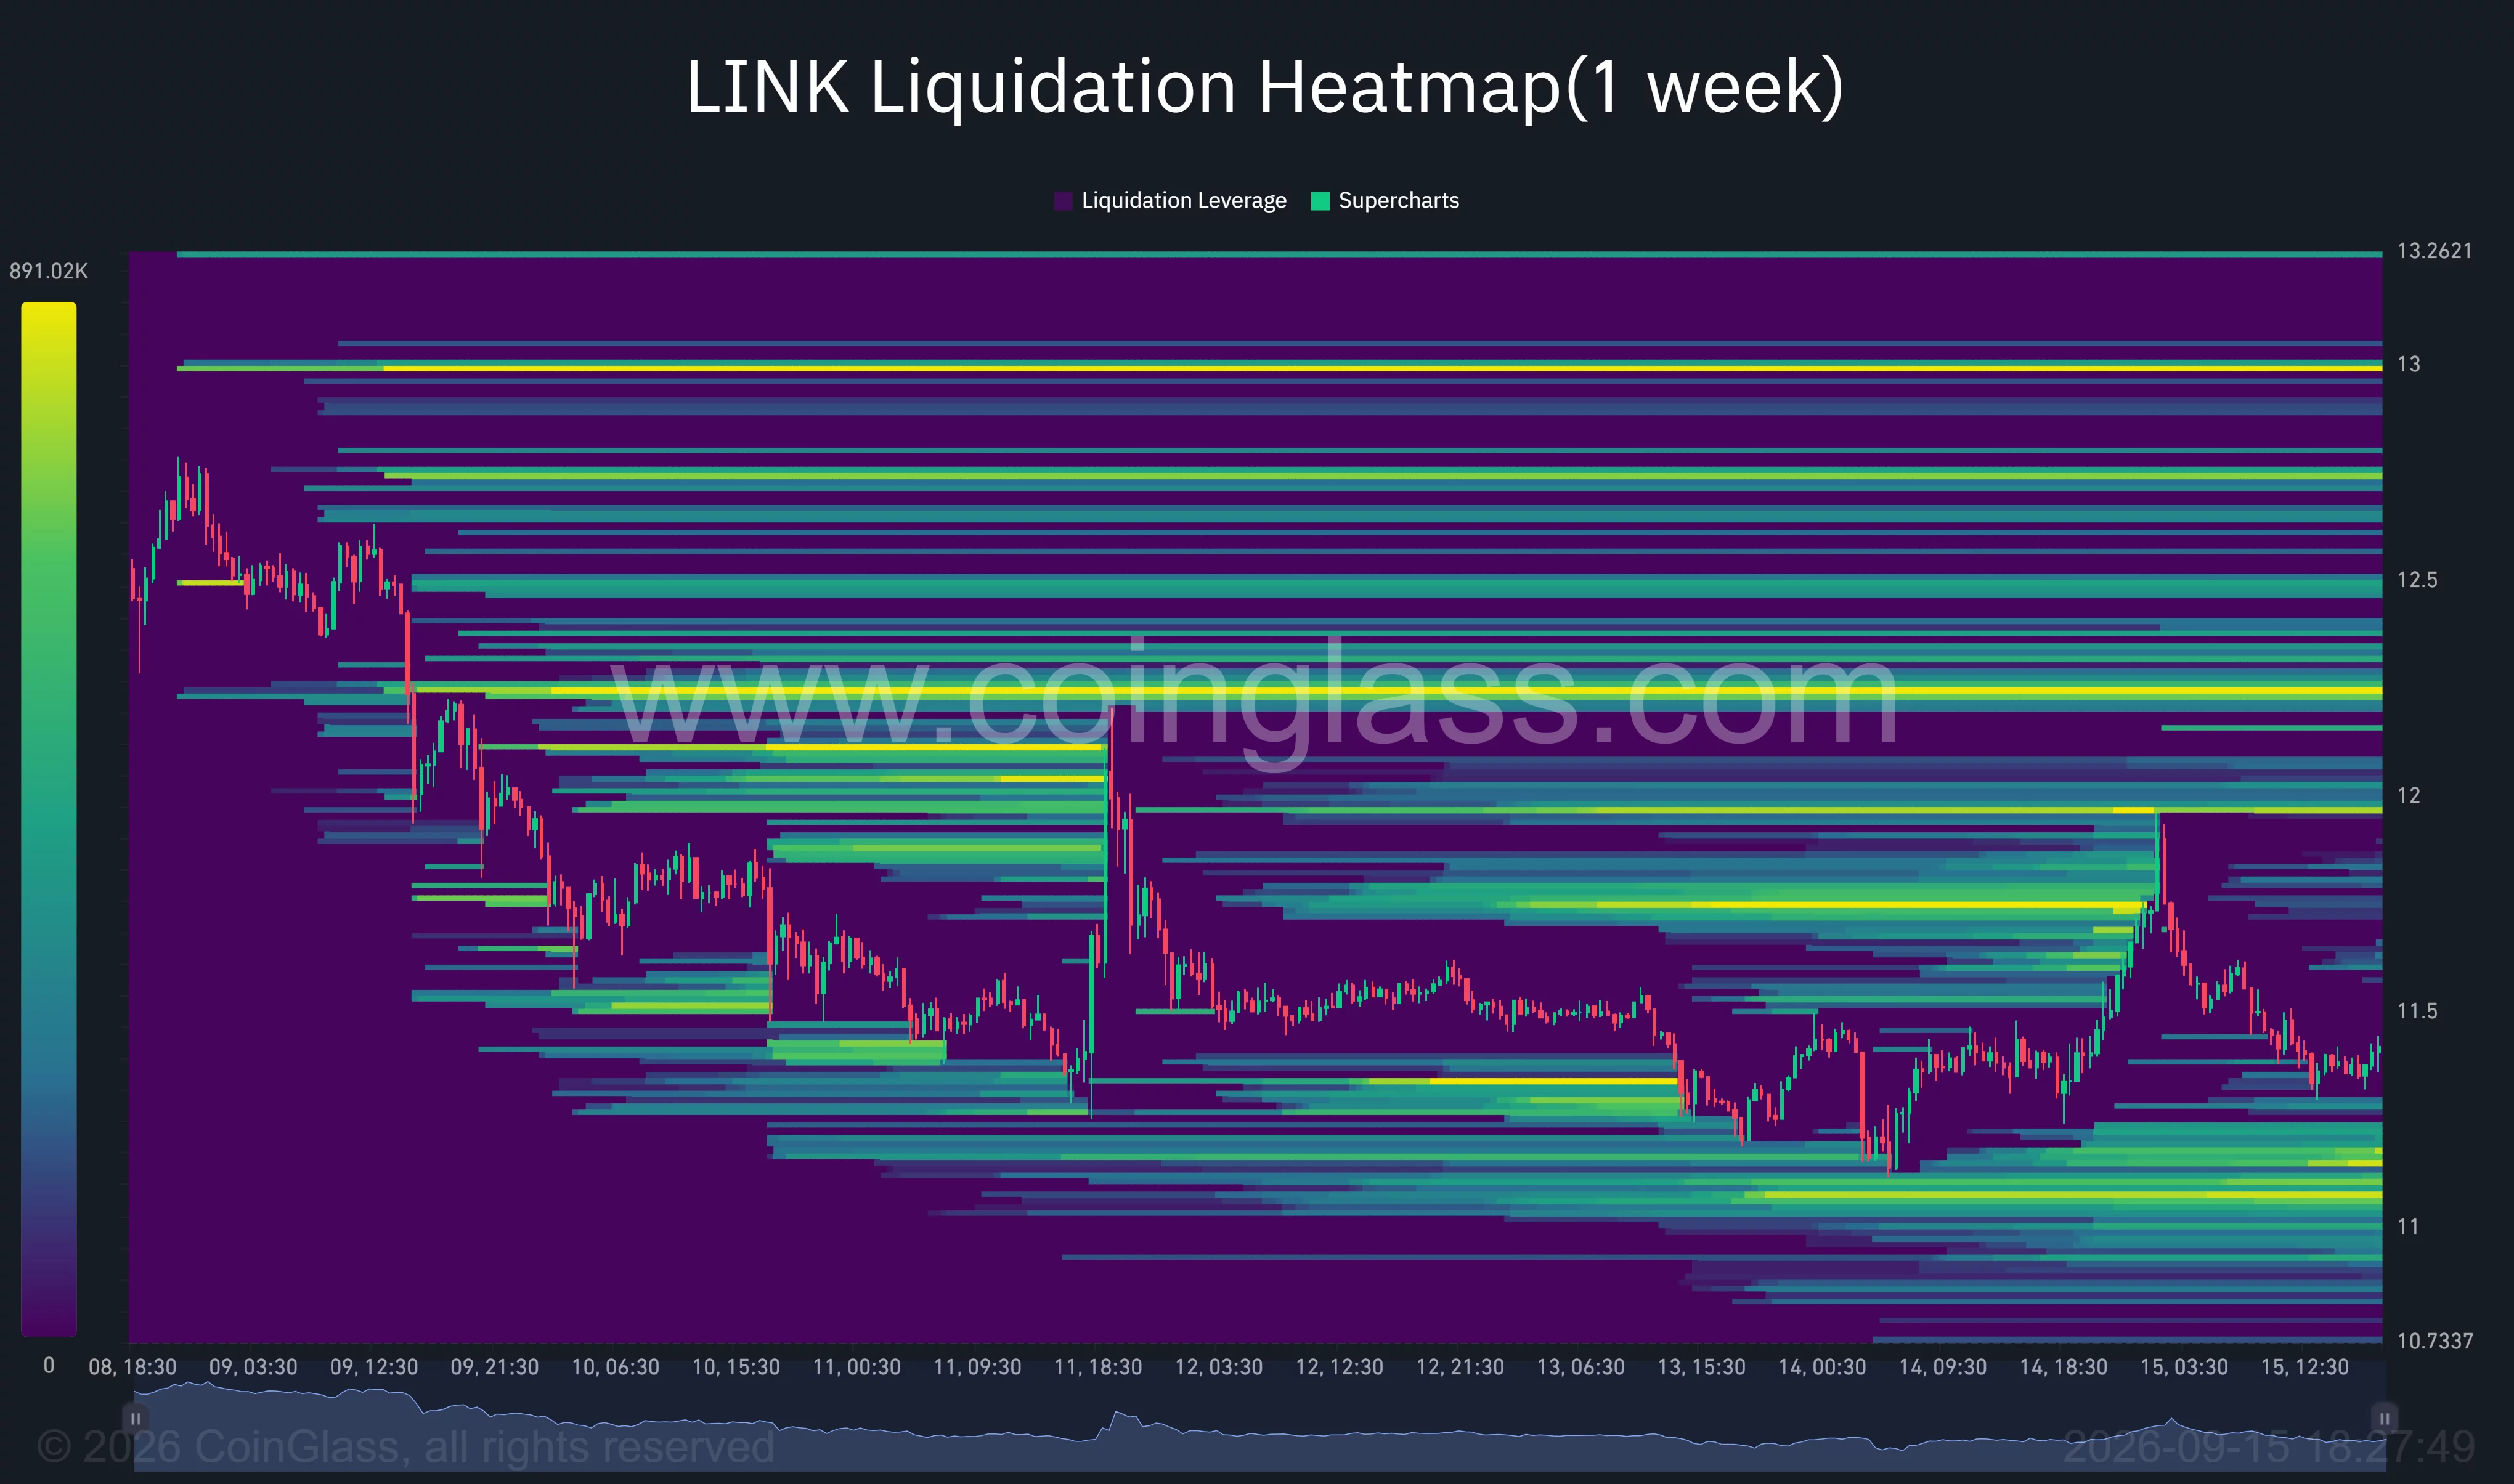
CoinGlass’ one-week liquidation heatmap showed a dense concentration of leveraged positions below the current price, particularly around $11.00–$11.15. The strongest lower cluster appeared close to $11.05, with additional liquidity extending toward $10.90.
Chainlink liquidation heatmap | Source:
CoinGlassLarge liquidation concentrations can attract price as traders target areas where leveraged positions may be forced to close. A drop below $11.20 could therefore accelerate toward $11.00 if long liquidations add mechanical selling pressure.
Upside liquidity was spread across several levels. The nearest visible concentrations sat around $11.70–$12.00, followed by stronger bands near $12.20 and $12.50. A particularly large cluster was visible around $13.00, although LINK would first need to reverse its lower-high structure to approach it.
The uneven distribution leaves LINK exposed to volatility in either direction. Lower liquidity sits closer to the current price, making the $11.00 region the more immediate level, while a break above $11.72 could force short positions to close and support a faster recovery.
For now, $10.94–$11.20 forms the main support zone, while $11.68–$11.72 remains the first resistance range. A decisive close outside those boundaries could determine whether LINK extends its correction toward $10.16 or begins another attempt at $12.50.
Disclosure: This article does not represent investment advice. The content and materials featured on this page are for educational purposes only.
Read more: Ethereum price loses $2,500 as MACD turns bearish