Cronos enters this session carrying more than just price data. A significant security event on its largest lending protocol has added a fresh risk dimension, even as the token's chart shows e
Cronos enters this session carrying more than just price data. A significant security event on its largest lending protocol has added a fresh risk dimension, even as the token's chart shows early signs of structural repair.
This Cronos Price Prediction weighs both threads together to frame where CRO's market structure stands right now.
What Does Cronos's Market Positioning Look Like Right Now?
CRO is trading near $0.05656, down 1.82% over the past 24 hours, according to CoinMarketCap data.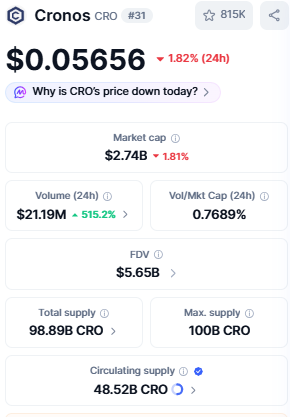
Market cap sits at $2.74 billion against a fully diluted valuation of $5.65 billion, reflecting a supply base of 98.89 billion CRO out of a 100 billion maximum, with 48.52 billion currently circulating.
Volume has spiked 515.2% to $21.19 million over the past day, a liquidity surge that lines up with today's broader news flow around this Cronos Price Prediction. Live figures can be tracked at coinmarketcap.com/currencies/cronos.
What Risk Does the Tectonic Exploit Add to Cronos Right Now?
Cronos's risk profile shifted sharply after its blockchain halted operations following an exploit on Tectonic, the network's largest lending protocol.
On-chain researcher Weilin Li estimates roughly $75 million in assets were affected, after an attacker inflated the price of Tectonic's TONIC token by close to 100 times within minutes and borrowed against the inflated collateral.
Only about $6 million reportedly reached Ethereum before validators halted the chain, leaving most of the exploit-linked funds stranded on $CRO itself.
Crypto.com's leadership has said the exchange and app remain unaffected, and neither C nor Tectonic has confirmed a restart timeline, keeping near-term uncertainty elevated around this Cronos Price Prediction.
How Is Liquidity Positioned Across the Derivatives Market?
Positioning across derivatives stays relatively contained. CRO is up 4.01% over 30 days but down 13.82% and 25.18% across the 90-day and 180-day windows, and the token remains down 37.65% year-to-date, according to Coinglass data.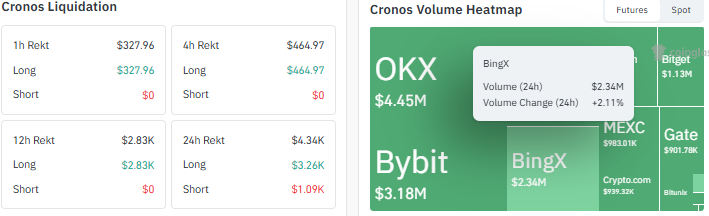
while 24-hour liquidations stayed light at roughly $4.34K, concentrated on longs. OKX leads futures volume at $4.45 million, followed by Bybit at $3.18 million.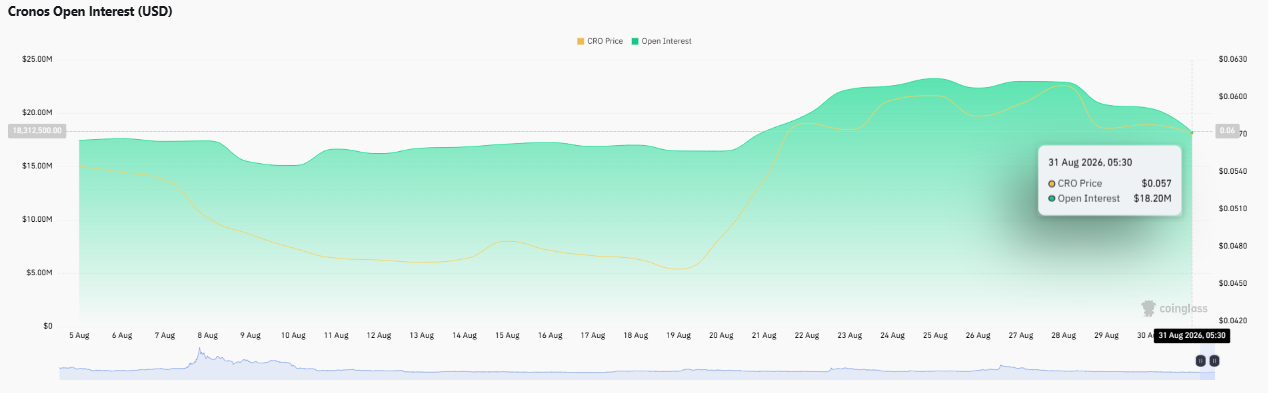
Open interest sits near $18.20 million after climbing from lows around $15 million earlier in August.
What Could Happen Next for CRO?
Before turning to CRO's chart structure, here is how different Cronos Price Prediction scenarios could play out from here.
Outlook
Trigger
Key Levels
Bullish
Price holds above the daily trendline support
0.06774 -> 0.08447 -> 0.09775 -> 0.11183
Neutral
Price consolidates between 0.05366 and 0.06774
0.05366 - 0.06774
Bearish
The daily trendline support breaks
0.05366 -> 0.04543
Does CRO's Chart Structure Support a Base-Building Thesis?
CRO's daily chart shows price holding above a descending trendline, and per the TradingView chart, that support has held through recent sessions.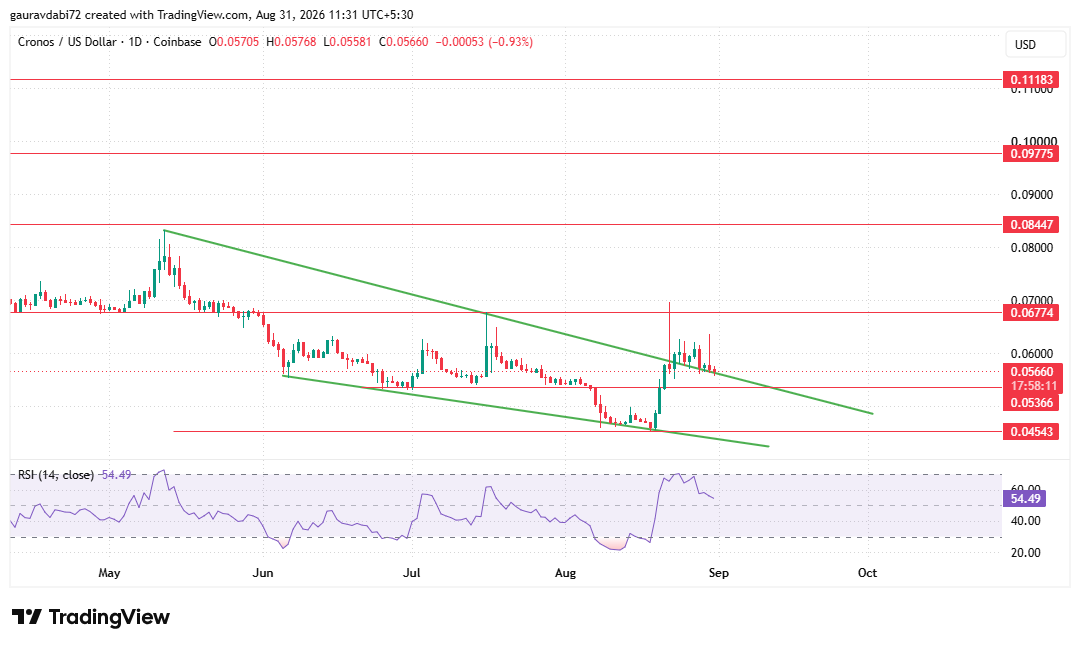
Sustaining this trendline keeps the structure constructive, with upside potential toward 0.06774, then 0.08447, 0.09775, and 0.11183.
Losing that trendline shifts focus to a stronger support zone at 0.05366 and 0.04543.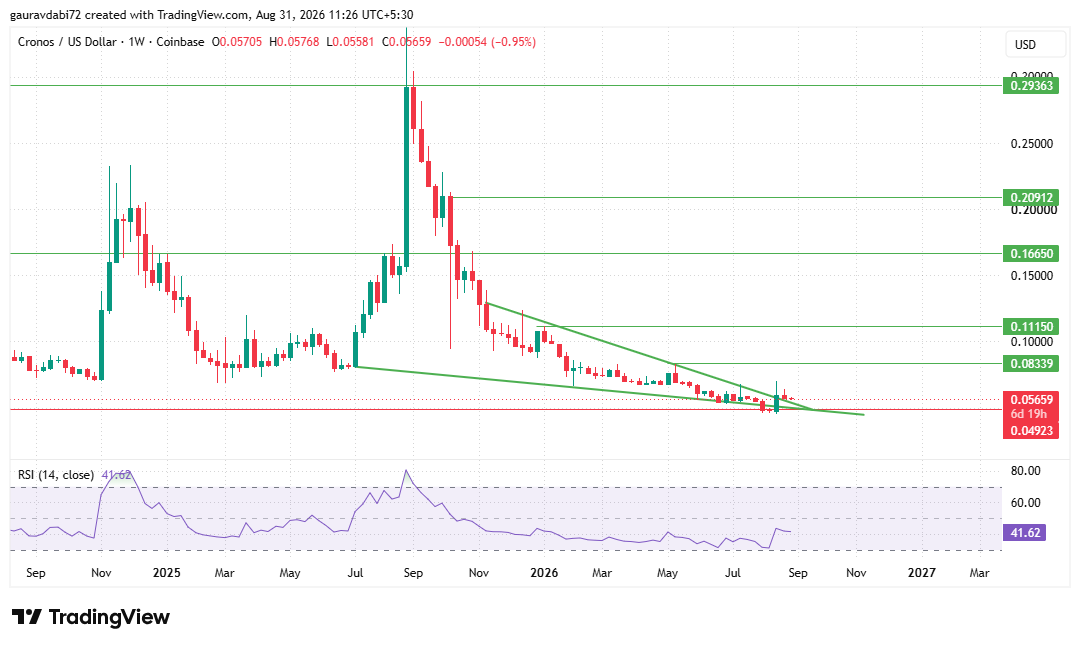
The weekly chart adds further context: CRO has produced a wedge pattern breakout, and a weekly close holding above that trendline would confirm a broader structural shift, with resistance then building toward 0.08339, 0.11150, 0.66650, 0.20912, and 0.29363, against downside support near 0.04932.
The daily RSI reads 54.49, mildly bullish, while the weekly RSI sits lower at 41.62, still below neutral, underscoring that the larger trend has yet to fully confirm even as shorter-term structure improves.
What Does the Analyst Make of This Setup?
As per the CoinGabbar analyst, CRO's setup reflects a market in transition: a constructive short-term price structure is developing against a backdrop of elevated event risk following the Tectonic exploit.
This Cronos Price Prediction leans cautiously constructive on a near-term basis, but a full trend change would require both a confirmed weekly close above the wedge trendline and clarity on how the exploit situation resolves.
Disclaimer: This article is for informational purposes only and does not constitute financial, investment, or trading advice. Cryptocurrency markets are highly volatile and unpredictable; readers should conduct their own research before making any decisions. CoinGabbar and the author bear no responsibility for losses incurred based on this content.