
Markets8 min read
Weekly Market Report | June 22–28, 2026
The result was a market that looked weak on the surface but remained structurally healthier than many previous corrections.
The crypto market has slipped another 0.58% over the past 24 hours, bringing the total market capitalization down to $2.06 trillion. Ethereum remains the biggest drag after fresh staking with
The crypto market has slipped another 0.58% over the past 24 hours, bringing the total market capitalization down to $2.06 trillion. Ethereum remains the biggest drag after fresh staking withdrawals and DeFi deleveraging added pressure across the altcoin market.
Bitcoin is also under pressure from ETF outflows, and thin liquidity continues to amplify every wave of selling. Crypto is moving in lockstep with stocks and gold right now, 85% with the S&P 500, 84% with gold.
Today matters. It could decide the whole week. Either buyers come back, or sellers keep running things.
Bitcoin is at $59,894.98, down 0.33% today. We pulled up the chart and it’s clear, the BTC price has been falling ever since it dropped from above $80,000 earlier this quarter.
It’s found some stability around $60,000, but every bounce ends the same way: lower highs keep showing up.
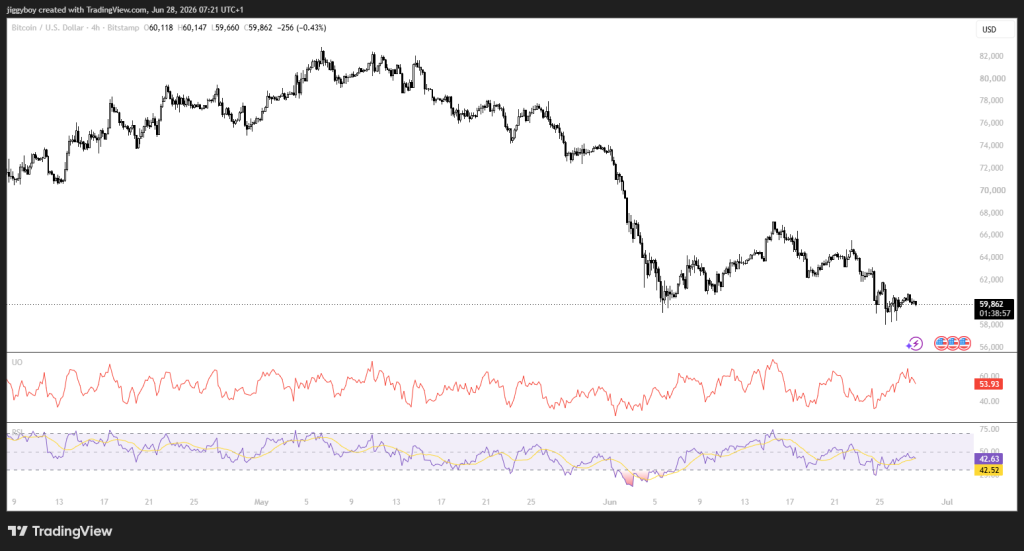 Source: Tradingview.com
The RSI is at 42.05, under the 50 line. That means weak momentum. The Stochastic is 58.21, some buying interest, but nothing that proves a real move up.
The Ultimate Oscillator is 52.31, right in the middle. Neither side has control. The MACD is positive at 109, which tells us the selling pressure is starting to ease up.
Indicator MetricReadingInterpretationRSI (14)42.05Sellers still have the edgeSTOCH (9,6)58.21Neutral with a slight bullish biasUltimate Oscillator52.31Momentum is balancedMACD109Selling pressure is easing, but no confirmed reversalBitcoin is still feeling the weight. A new report pointed out that a lot of the bullish stories people told for 2026 never happened. BTC is now roughly half of what it hit in 2025.
And during the latest economic jitters, it didn’t even beat gold, which worried a lot of people. On top of that, Jeremy Grantham, the old-school investor, called Bitcoin a speculative bet that doesn’t produce any income. That comment didn’t help either.
Another risk comes from regulation. Grayscale Research warned that delays to the CLARITY Act could force digital asset treasury companies to reduce exposure, increasing sell-side pressure. The bill’s Senate outlook has tightened to roughly 50-50 ahead of the limited July legislative window.
Bullish Path:
If BTC gets past $60,200, buyers might push for $61,000. After that, $62,000 is the next wall.
Neutral Case:
If it stays between $59,500 and $60,200, expect more of the same, flat and boring for the rest of the day.
Bearish Prediction:
If it drops under $59,500, we could see it fall to $58,500. Then $58,000 would be the next floor.
The XRP price is trading at $1.04, down 1.12% today. We had a look at the chart and found the broader trend remains bearish, with price continuing to print lower highs after failing to hold its mid-June recovery above $1.25. Buyers are trying to defend the area around $1.04, though momentum remains weak.
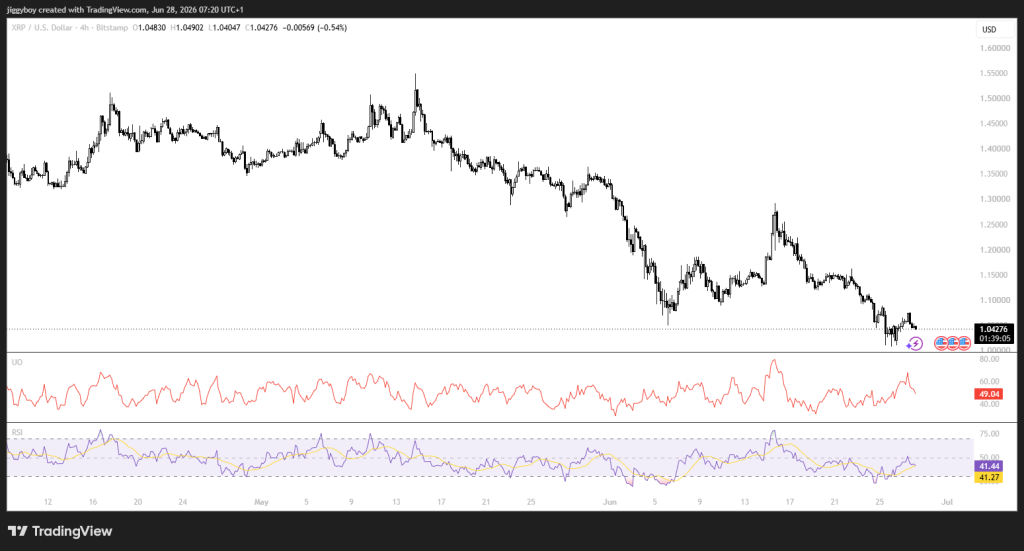 Source: Tradingview.com
The RSI reads 41.44, keeping sellers in control. The Stochastic indicator is 55.55, showing neutral momentum, the Ultimate Oscillator reads 49.04, and the MACD is only 0.00292, pointing to limited buying strength.
Indicator MetricReadingInterpretationRSI (14)41.44Sellers remain in controlSTOCH (9,6)55.55Neutral momentumUltimate Oscillator49.04Buyers and sellers are evenly matchedMACD0.00292Very weak bullish momentumCompetition in tokenized real-world assets remains one of the biggest talking points. Stellar now hosts roughly $3 billion in RWAs compared with about $330 million on the XRP Ledger, despite XRP maintaining a much larger market capitalization.
Also, analysts pointed to a Tom DeMark Sequential buy signal and a Morning Star Doji pattern, with the CLARITY Act still viewed as a possible catalyst if it advances in July.
The derivatives market has also gone through a deep reset. Long bets got wiped out hard, up 832%, totaling nearly $3 million. Open interest fell from $1.18 billion to $1.04 billion. Funding rates flipped negative. But spot reserves haven’t moved much. That leaves space for a cleaner bounce if buyers decide to come back.
Bullish Prediction:
A move above $1.06 could lift the XRP price toward $1.08, with $1.10 becoming the next target.
Neutral Prediction:
Holding between $1.03 and $1.06 could keep the XRP price trading in a tight range today.
Bearish Prediction:
Losing $1.03 could send the XRP price back to $1.00, with $0.98 becoming the next support.
The ETH price is trading at $1,563.30, down 0.8% today. We had a look at the chart and found ETH remains in a firm downtrend after falling from above $2,300 earlier in the quarter. The price keeps making lower highs. Buyers still can’t push it back above $1,600.
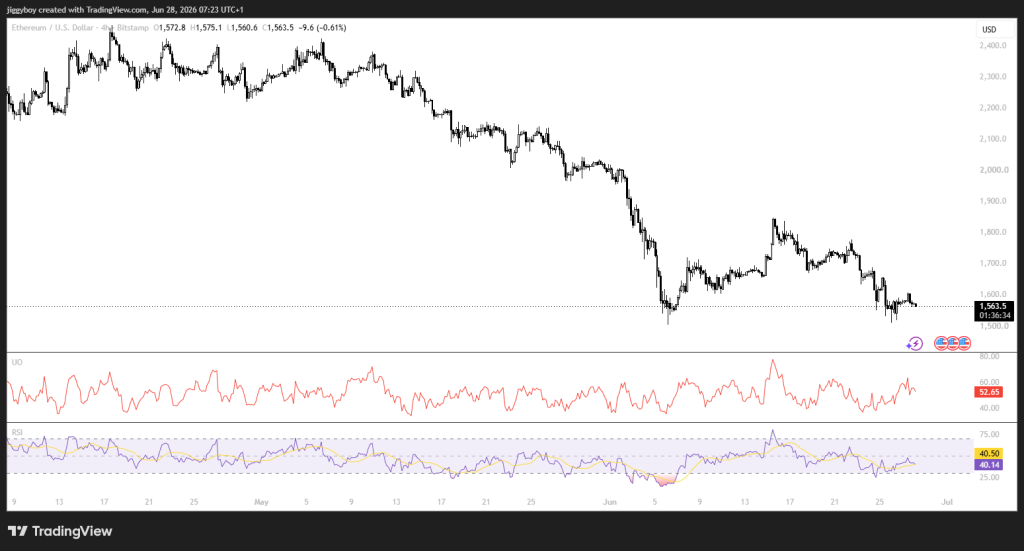 Source: Tradingview.com
RSI is at 40.10, below the midpoint, so momentum is weak. Stochastic is 53.36. Ultimate Oscillator is 52.19. MACD is positive at 3.9, which means selling is losing steam, but there’s no real sign of a turn yet.
Related XRP News: What Happens to the XRP Price if the Crypto Bear Market Gets Worse?
Indicator MetricReadingInterpretationRSI (14)40.10Bearish momentum remains dominantSTOCH (9,6)53.36Neutral with a slight recovery attemptUltimate Oscillator52.19Momentum is balancedMACD3.9Selling pressure is easing but buyers have not taken controlSharplink Gaming started buying Ethereum again after eight months of doing nothing. They picked up 5,000 ETH, about $18 million, through FalconX. Now they hold 876,285 ETH, worth around $1.38 billion. Almost all of it is staked, even though they’re down about $1.7 billion on paper.
On top of that, Ethereum’s world took another hit. The MEV bot known as Jaredfromsubway.eth got hit by a complex exploit and lost somewhere between $7.5 million and $15 million. The incident exposed weaknesses in automated trading systems and renewed concerns about risks across DeFi infrastructure.
Bullish Path:
If ETH breaks $1,580, buyers might run it up to $1,600. Past that, $1,640 is the next stop.
Neutral Prediction:
If it stays between $1,550 and $1,580, expect more of the same, chopping sideways all day.
Bearish Case:
If the ETH price drops under $1,550, we could see it fall to $1,500. Then $1,480 becomes the next floor.

Most analysts and prediction markets forecast Bitcoin’s cycle low in 2026 to land between $40,000 and $50,000. After setting all-time highs of roughly $126,000 in late 2025, the cryptocurrency entered a prolonged correction period.
Is XRP a better investment than EthereumXRP and Ethereum serve different purposes. XRP focuses on cross-border payments, while Ethereum powers smart contracts and decentralized applications. The better investment depends on an investor’s goals and risk tolerance.
Can XRP reach $100 dollarsAlmost certainly not in 2026. That would require a market cap of over $5 trillion, far larger than all crypto combined today. Even the most optimistic long‑term forecasts (2030+) place XRP in the $3‑$30 range, with $100 requiring a global monetary reset and mass institutional adoption. It is a lottery‑ticket scenario, not a base case.
Subscribe to our YouTube channel for daily crypto updates, market insights, and expert analysis.
The post Crypto Price Prediction for Today, June 28: Bitcoin (BTC), XRP, Ethereum (ETH) appeared first on CaptainAltcoin.