XRP and Ethereum pushed toward the upper ends of their recent trading ranges yesterday, but neither held those moves. Cardano also remains inside its consolidation, where a support level that
XRP and Ethereum pushed toward the upper ends of their recent trading ranges yesterday, but neither held those moves. Cardano also remains inside its consolidation, where a support level that has held since mid-September faces another test.
That leaves today’s crypto price prediction focused on whether these familiar patterns continue or finally give way. XRP, Ethereum, and Cardano have clear boundaries to watch, although their indicators offer different clues about which side could take control. Yesterday’s pullbacks make the next attempts to break those boundaries especially important.
XRP Price Returns To Consolidation After Rejection Near $1.55
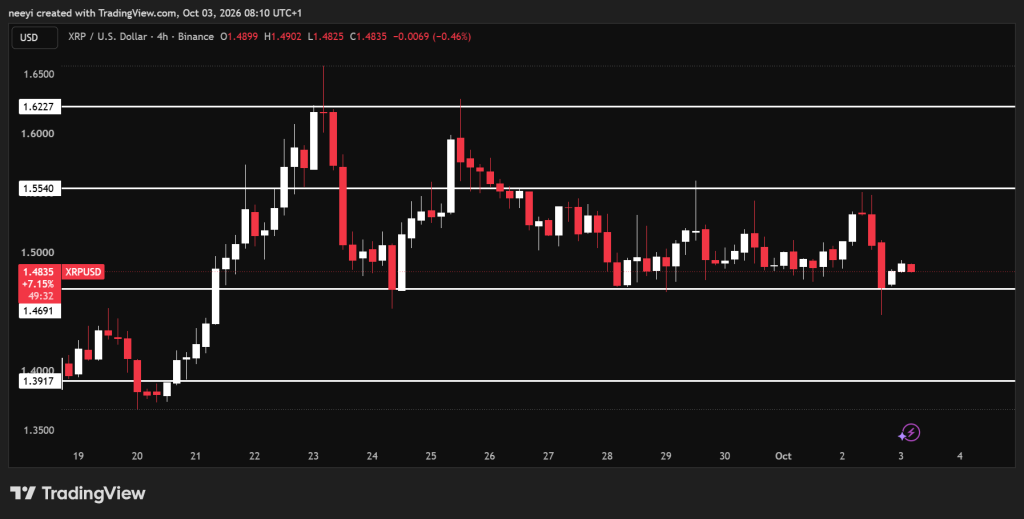
XRP price reached around $1.55 yesterday before falling to approximately $1.44. The recovery afterward brought it back into its main consolidation range, which remains roughly between $1.46 and $1.55.
That move below support deserves attention because XRP did not remain beneath the range. Sellers pushed the price lower, but the recovery prevented that decline from developing into a sustained breakdown.
XRP Price Chart / TradingView.com
The $1.46 to $1.47 area now becomes the immediate support zone to watch. XRP could continue moving between that base and $1.55 today unless either side produces a stronger move.
A break above $1.55 would open a possible path toward $1.62. A sustained decline beneath support could instead bring $1.39 into view before the day ends.
XRP Technical Indicators Show Weak Momentum And Seller Pressure
RSI (14): The reading of 45.649 is neutral, although its position below 50 gives sellers a modest advantage. XRP is neither overbought nor oversold, so this indicator leaves room for movement in either direction.
MACD (12,26): The reading of −0.007 carries a sell signal. Negative momentum supports the possibility of another support test unless buying pressure improves.
ADX (14): The reading of 37.025 points to an established trend. The supplied table labels it Buy, but ADX measures trend strength rather than direction, so it does not independently confirm a bullish move.
Bull/Bear Power (13): The reading of −0.0258 carries a sell signal and indicates stronger seller pressure. That helps explain why XRP struggled to hold its move toward resistance.
Indicator
Value
Action And Brief Explanation
RSI (14)
45.649
Neutral: Momentum remains below the midpoint.
MACD (12,26)
−0.007
Sell: Negative momentum favors seller pressure.
ADX (14)
37.025
Buy label supplied: Trend strength is elevated, but direction requires confirmation.
Bull/Bear Power (13)
−0.0258
Sell: Bears retain the stronger influence.
XRP Price Prediction For Today
- Bullish Scenario: XRP holds support and breaks above $1.55, which could allow a move toward $1.62.
- Neutral Scenario: XRP continues trading between approximately $1.46 and $1.55 as neither side establishes control.
- Bearish Scenario: XRP loses the $1.46 to $1.47 support zone and stays below it, which could expose $1.39.
Ethereum Price Tests Consolidation Support After Yesterday’s Pullback
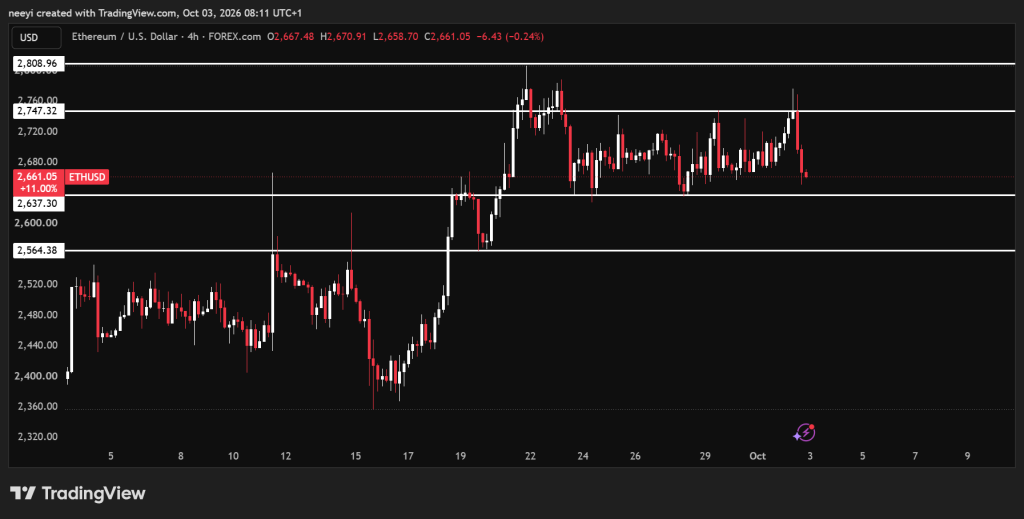
Ethereum price reached approximately $2,770 yesterday before returning to its consolidation. ETH now trades close to the lower boundary around $2,630, so the immediate question is whether that support holds again.
The latest retreat shows that yesterday’s move above $2,750 did not produce a lasting breakout. Ethereum needs to recover that level and hold above it to make another upward attempt more convincing.
ETH Price Chart / TradingView.com
A bounce from $2,630 could send Ethereum price back toward $2,750. A successful break above that resistance could then bring $2,800 into reach.
The downside path depends on a loss of $2,630. Ethereum could fall toward $2,500 today if sellers break support and prevent a quick recovery.
Ethereum Technical Indicators Give Mixed Signals Near Support
RSI (14): The reading of 47.104 remains neutral and slightly below 50. Buyers have room to improve momentum, but the current reading does not establish bullish control.
MACD (12,26): The reading of 0.03 carries a buy signal. Positive momentum offers some support for a recovery, although the signal needs confirmation from the price holding support.
ADX (14): The reading of 27.67 indicates some trend strength. Its supplied Buy label should be read alongside directional indicators because ADX alone cannot determine whether buyers or sellers lead.
Bull/Bear Power (13): The reading of −34.7961 carries a sell signal. Seller pressure remains present despite the positive MACD, which explains the mixed outlook.
Indicator
Value
Action And Brief Explanation
RSI (14)
47.104
Neutral: Momentum remains slightly below 50.
MACD (12,26)
0.03
Buy: Positive momentum supports a possible recovery.
ADX (14)
27.67
Buy label supplied: Some trend strength exists, without directional confirmation.
Bull/Bear Power (13)
−34.7961
Sell: Seller pressure remains active near support.
Ethereum (ETH) Price Prediction For Today
- Bullish Scenario: Ethereum rebounds from $2,630, recovers $2,750, and breaks higher toward $2,800.
- Neutral Scenario: ETH holds support but remains within the approximately $2,630 to $2,750 range.
- Bearish Scenario: Ethereum breaks beneath $2,630 and fails to recover, which could allow a decline toward $2,500.
Cardano Price Remains Between Established Support And Recent Resistance
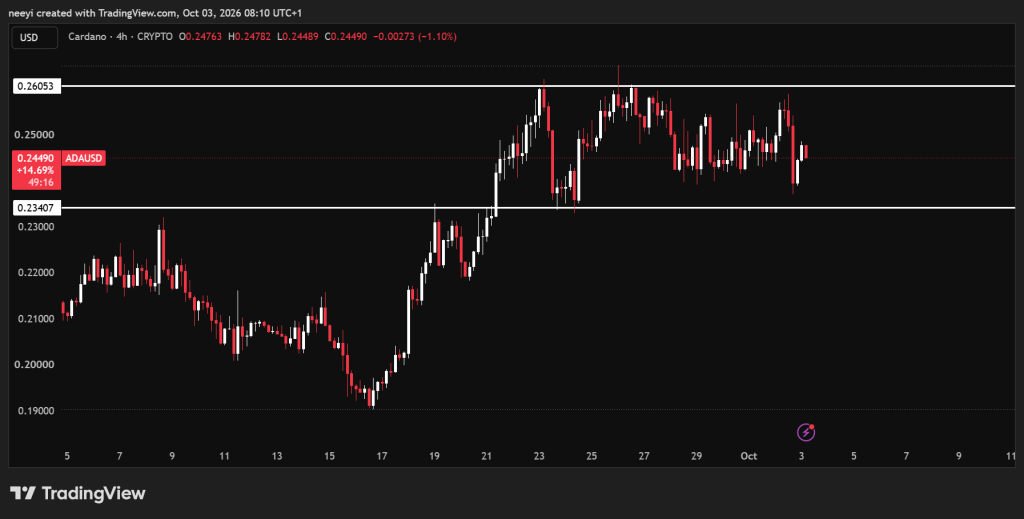
Cardano price continues consolidating mainly between $0.23 and $0.26. The lower boundary has held since mid September, which gives today’s support test some historical context.
ADA Price Chart / TradingView.com
The $0.26 resistance developed more recently, but it remains the upper boundary ADA needs to clear. Until either level breaks, continued movement inside the range remains a plausible outcome.
A sustained break above $0.26 could allow Cardano price to reach $0.28 today. A breakdown beneath $0.23 could open the downside toward $0.21.
Cardano Technical Indicators Favor Consolidation Despite Bearish Pressure
RSI (14): The reading of 47.593 is neutral and close to the midpoint. ADA lacks a clear momentum advantage for either side.
MACD (12,26): The displayed value is 0, but the supplied action is Sell. The rounded figure alone does not explain that classification or establish the strength of bearish momentum.
ADX (14): The reading of 19.312 is neutral and indicates weak trend strength. This fits Cardano’s consolidation better than a strong directional move.
Bull/Bear Power (13): The reading of −0.0032 carries a sell signal. Bears retain an advantage, although price still needs to break support to confirm a downside move.
Indicator
Value
Action And Brief Explanation
RSI (14)
47.593
Neutral: Momentum remains near the midpoint.
MACD (12,26)
0
Sell: Supplied classification; the rounded value limits interpretation.
ADX (14)
19.312
Neutral: Weak trend strength supports consolidation.
Bull/Bear Power (13)
−0.0032
Sell: Bears retain the stronger influence.
Cardano (ADA) Price Prediction For Today
- Bullish Scenario: Cardano breaks above $0.26 and holds that level, which could bring $0.28 into reach.
- Neutral Scenario: ADA continues moving between $0.23 and $0.26 without a confirmed breakout.
- Bearish Scenario: Cardano loses its established $0.23 support, which could allow a decline toward $0.21.
FAQs
Will Cardano ADA reach $10?
Cardano (ADA) reaching $10 is considered highly unlikely by most mainstream forecasting models and algorithmic predictions in the near future.
How much will 1 Ethereum be worth in 2030?
By 2030, mainstream financial institutions and market analysts project a realistic base-case value for Ethereum (ETH) between $8,000 and $22,000 per coin, though extreme forecasts range from a conservative $3,200 up to an optimistic $40,000+. Because cryptocurrency values are highly speculative and depend heavily on global software adoption, regulatory updates, and market liquidity, there is no single guaranteed price.
Subscribe to our YouTube channel for daily crypto updates, market insights, and expert analysis.
The post Crypto Price Prediction For Today, October 3: XRP, Ethereum (ETH), Cardano (ADA) appeared first on CaptainAltcoin.