

CVC price prediction 2025-2031: How high can Civic coin go?
 ETH
ETH
 CVC
CVC
 BULLISH
 SOL
SOL
 CIN
CIN
Key takeaways
- CVC price prediction shows an optimistic outlook; it will rise to $0.2566 by the end of 2025.
- In 2028, CVC is predicted to reach a maximum price of $0.8119.
- Long-term price predictions for Civic Coin also present a favorable outlook, with the cryptocurrency reaching $2.64 by 2031.
Civic (CVC) is a blockchain-based platform specializing in decentralized identity verification. It enables users to securely manage personal data without relying on centralized systems.
In 2021, Civic transitioned from Ethereum to the Solana blockchain, enhancing scalability and reducing transaction costs. This move facilitated the implementation of Proof of Personhood (PoP), verifying unique human identities to ensure each person is linked to a single wallet.
Additionally, Civic has partnered with platforms like Paydece to bolster security against fraud while maintaining a decentralized, user-driven model. Civic’s partnerships, technological advancements, and increasing interest in identity verification solutions contribute to its long-term potential.
This price prediction explores Civic’s future trajectory. Whether you’re an investor or simply curious about Civic’s role in blockchain innovation, this prediction offers valuable insights into its potential.
Will Civic recapture its all-time high? Will the coin reach $2 soon? Let’s get into the details.
Overview
| Cryptocurrency | Civic Coin |
| Token | CVC |
| Price | $0.168 |
| Market Cap | $167.72M |
| Trading Volume | $20.39M |
| Circulating Supply | 1B CVC |
| All-time High | $1.66, Dec 25, 2017 |
| All-time Low | $0.01081, Mar 13, 2020 |
| 24-hour High | $0.1719 |
| 24-hour Low | $0.164 |
CVC technical analysis
| Metric | Value |
| Price Prediction | $ 0.250491 (48.90%) |
| Volatility | 6.45% |
| 50-Day SMA | $ 0.180184 |
| 14-Day RSI | 55.20 |
| Sentiment | Neutral |
| Fear & Greed Index | 75 |
| Green Days | 16/30 (53%) |
| 200-Day SMA | $ 0.131987 |
CVC price analysis: Volatility dominates with key support at $0.164
TL;DR Breakdown
- Civic’s price is consolidating in a narrow range, showing uncertainty about the next big move.
- RSI near 50 signals neutral momentum, while MACD hints at weak bullishness.
- Low trading volume may limit action but could spark a breakout with any surge.
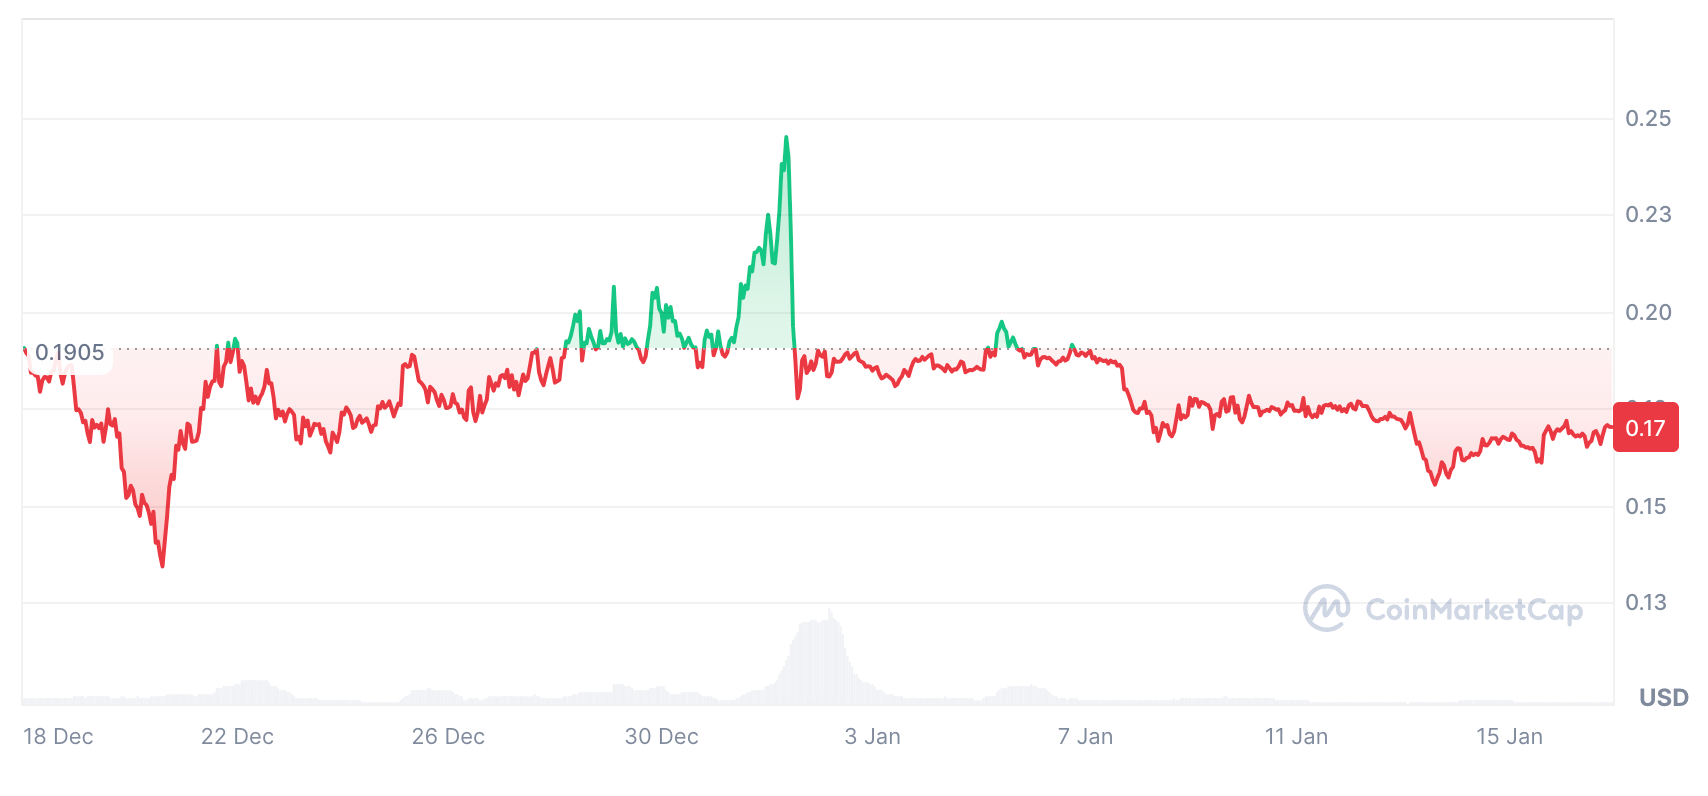
The Civic (CVC) price analysis for January 16 shows fluctuation between $0.164 and $0.172 over the observed period. The price started around $0.1706, experienced a slight upward spike in the afternoon, and then declined steadily. The late session saw the price drop below $0.166 before recovering slightly to $0.168. This pattern indicates a volatile market with bearish pressure dominating overall.
Civic price analysis 1-day price chart: Bearish momentum persists
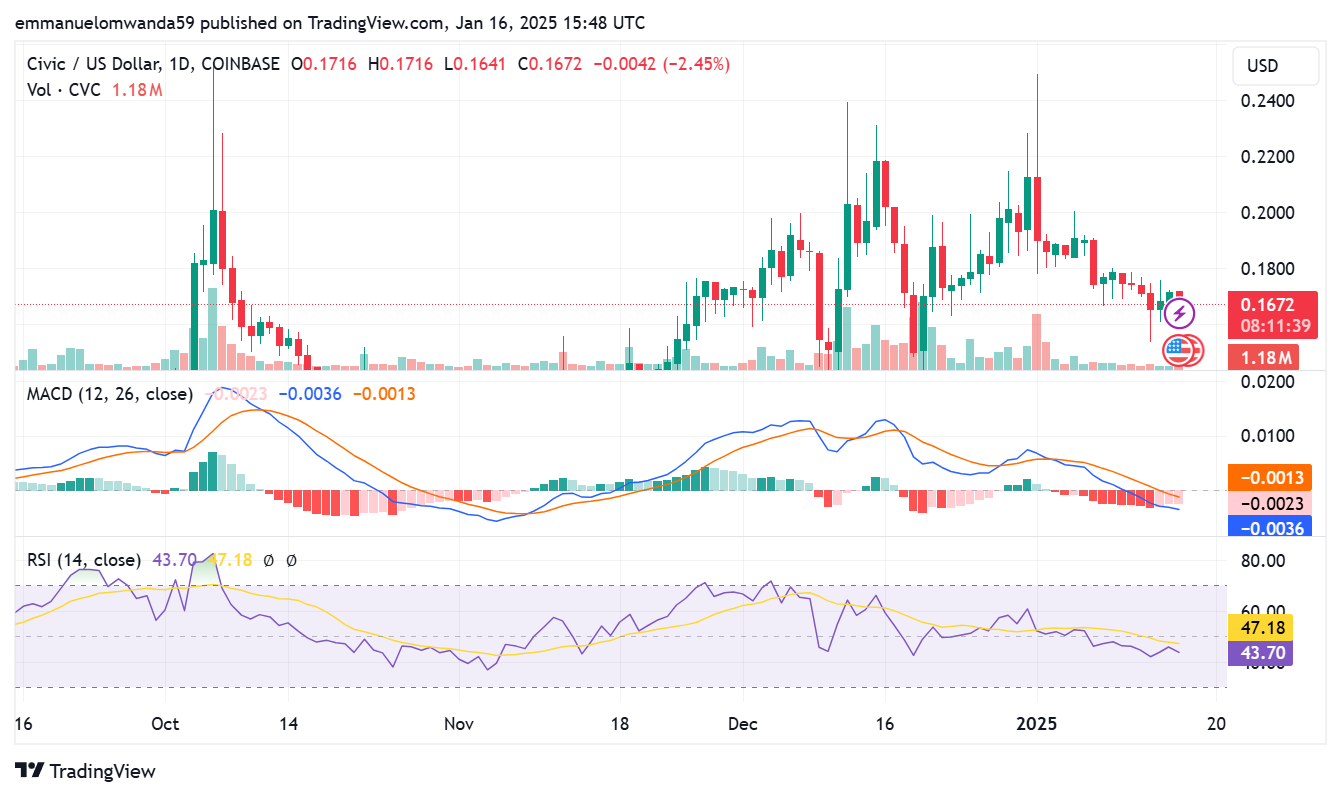
The 1-day Civic (CVC) chart shows a steady downtrend in recent days, with the price currently trading around $0.1672 after a 2.45% decrease. The chart indicates lower highs and lower lows, suggesting bearish momentum. Additionally, the trading volume is at 1.18 million, reflecting moderate activity. The price has been struggling to regain bullish momentum and is nearing its support level at $0.1641, with resistance around $0.1800.

The MACD (Moving Average Convergence Divergence) is in the negative zone, with the MACD line below the signal line, signaling a bearish trend. The RSI (Relative Strength Index) is at 43.70, slightly below the neutral 50 level, which suggests mild selling pressure but not yet oversold territory.
CVC/USD 4-hour price chart: Consolidation phase for Civic
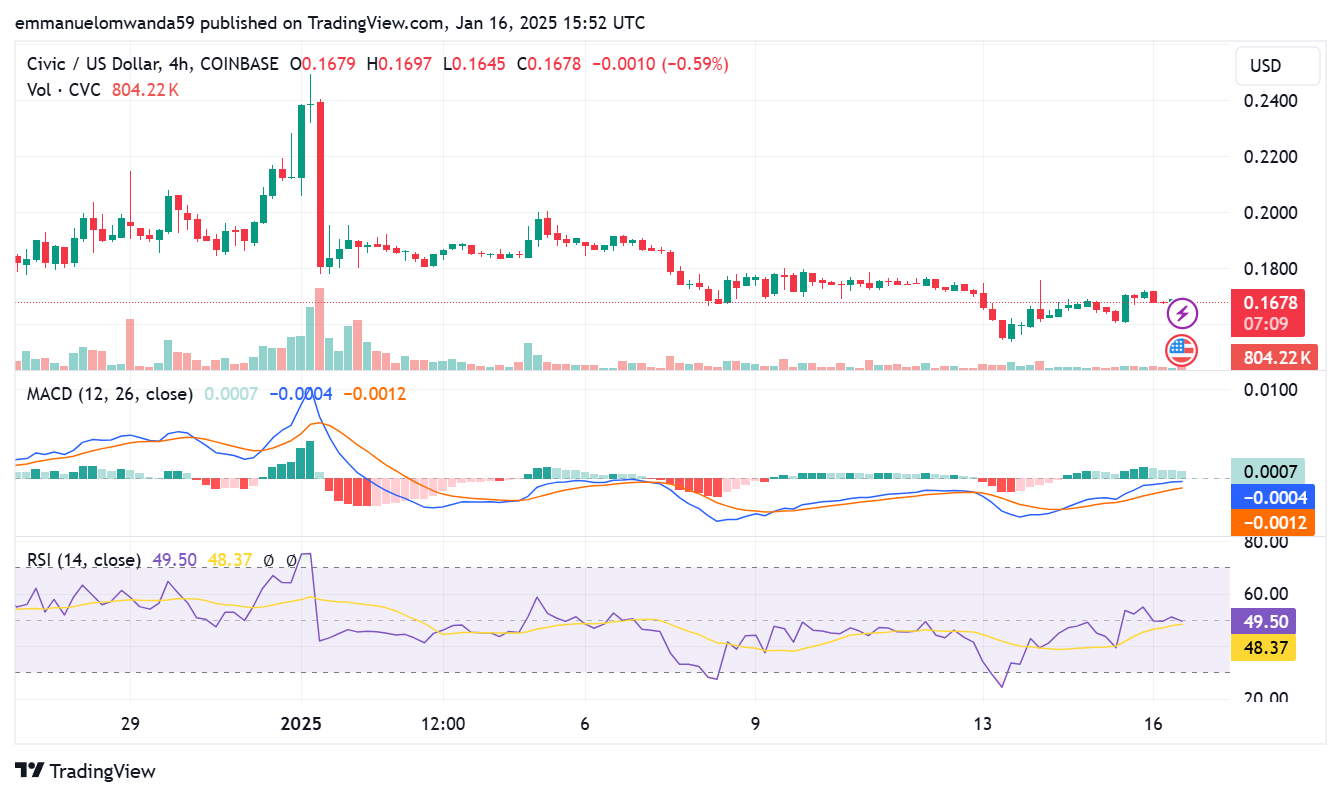
The 4-hour Civic (CVC) chart shows a relatively sideways movement with minor fluctuations around the $0.1678 mark. The price has failed to sustain significant upward momentum, facing resistance near $0.1697 while maintaining support around $0.1645. The reduced trading volume suggests a lack of strong market activity, leading to indecisive price action in the short term.

The MACD (Moving Average Convergence Divergence) indicator shows a slight bullish crossover, with the MACD line (blue) barely crossing above the signal line (orange). However, the histogram bars remain small, indicating weak momentum. The RSI (Relative Strength Index) sits near the neutral 50 level, suggesting the market is neither overbought nor oversold. This combination of indicators reflects a consolidation phase where the price could break out in either direction depending on future volume and market sentiment.
Civic Coin technical indicators: Levels and action
Daily simple moving average (SMA)
| Period | Value | Action |
| SMA 3 | $ 0.172417 | SELL |
| SMA 5 | $ 0.171397 | SELL |
| SMA 10 | $ 0.176791 | SELL |
| SMA 21 | $ 0.184085 | SELL |
| SMA 50 | $ 0.180184 | SELL |
| SMA 100 | $ 0.159806 | BUY |
| SMA 200 | $ 0.131987 | BUY |
Daily exponential moving average (EMA)
| Period | Value | Action |
| EMA 3 | $ 0.169253 | SELL |
| EMA 5 | $ 0.172167 | SELL |
| EMA 10 | $ 0.176938 | SELL |
| EMA 21 | $ 0.18038 | SELL |
| EMA 50 | $ 0.175044 | SELL |
| EMA 100 | $ 0.161803 | BUY |
| EMA 200 | $ 0.147289 | BUY |
What to expect from Civic
Civic’s (CVC) recent price analysis suggests a phase of consolidation with limited volatility, as the 4-hour chart highlights a lack of strong directional momentum. The RSI hovers near the neutral 50 level, indicating a balanced tug-of-war between buyers and sellers.
Meanwhile, the MACD reflects a slight bullish crossover, hinting at potential upward momentum, though the histogram shows modest activity. With trading volume relatively low, significant movement may depend on a shift in market sentiment or an influx of trading activity.
Is CVC a good investment?
Based on the current technical analysis and market data, Civic Coin shows signs of a bullish trend, with increasing buying activity pushing its price higher to $0.1089. The indicators, including moving averages and RSI, suggest mixed signals but point towards potential growth overall. However, investors should consider the volatility indicated by expanding Bollinger Bands and the overbought RSI, which may imply short-term price fluctuations.
Will Civic Coin reach $0.5?
Civic Coin (CVC) can reach $0.5 based on current trends and forecasts in 2027.
Will Civic Coin reach $1?
According to projections, reaching $1 for Civic Coin (CVC) will be within reach in approximately 2029.
Will Civic Coin reach $2?
Reaching $2 for Civic Coin (CVC) is a longer-term target requiring significant market expansion and favorable conditions. The earliest it might reach $2 is 2031.
Does Civic Coin have a good long-term future?
Civic Coin (CVC) appears to have a promising long-term future. Its focus on identity management solutions through initiatives like Civic Pass and collaborations across the blockchain ecosystem position it well for sustained growth. The projected price increases over the years also indicate optimism among analysts regarding Civic market potential.
Recent news/opinion on Civic
- Civic Pass is now integrated with Solana Token Extensions
Civic price prediction January 2025
The CVC price prediction for January 2025 estimates a price range of $0.1577 to $0.1862 and an average price expectation of approximately $0.1716.
| Month | Minimum Price | Average Price | Maximum Price |
| January | $0.1577 | $0.1716 | $0.1862 |
CVC price prediction 2025
In 2025, Civic Coin (CVC) will range between $0.2181 and $0.2566, with an average projected price of approximately $0.2258. This prediction indicates optimism in CVC’s potential for growth over the year, subject to market dynamics, adoption trends, and technological advancements within the Civic ecosystem.
| Year | Minimum Price | Average Price | Maximum Price |
| 2025 | $0.2181 | $0.2258 | $0.2566 |
CVC price predictions 2026 – 2031
| Year | Minimum Price | Average Price | Maximum Price |
| 2026 | $0.3232 | $0.3345 | $0.3866 |
| 2027 | $0.4787 | $0.4955 | $0.5542 |
| 2028 | $0.6932 | $0.7131 | $0.8119 |
| 2029 | $1.02 | $1.05 | $1.19 |
| 2030 | $1.51 | $1.55 | $1.79 |
| 2031 | $2.17 | $2.23 | $2.64 |
CVC price prediction 2026
The Civic prediction for 2026 suggests a notable inclination for the cryptocurrency. Its maximum price is expected to reach $0.3866. Civic’s price could be around a minimum of $0.3232, with an average price of $0.3345.
Civic price forecast 2027
In 2027, Civic CVC price prediction is projected to experience significant growth. The maximum forecasted price is $0.5542, with an average price expected to reach $0.4955 and a minimum of $0.4787.
CVC price prediction 2028
In the CVC price forecast for 2028, we foresee the cryptocurrency potentially reaching a peak of $0.8119. The average price is projected to stabilize around $0.7131, with a minimum expected at $0.6932.
CVC price prediction 2029
Analysts predict Civic Coin could reach a peak value of $1.19 in 2029. The projected minimum trading price is expected to be $1.02, providing a potential support level. The average market value is projected to be around $1.05.
CVC price prediction 2030
According to the CVC price prediction for 2030, analysts anticipate the cryptocurrency potentially reaching a peak price of $1.79. The projected minimum price is expected to be $1.51, with an average trading price of around $1.55.
CVC price prediction 2031
According to the Civic Coin price prediction for 2031, analysts foresee the cryptocurrency potentially reaching a maximum price of $2.64. The projected minimum price is expected to be $2.17, with an average value of around $2.23.
CVC market price prediction: Analysts’ Civic Coin price forecast
| Firm Name | 2025 | 2026 |
| Changelly | $0.2826 | $0.4071 |
| Gate.io | $0.1176 | $0.1325 |
| Digital Coin Price | $0.37 | $0.44 |
Cryptopolitan’s Civic Coin (CVC) price prediction
Cryptopolitan predicts steady growth for Civic (CVC) in the coming years. By 2025, prices are expected to range between $0.1745 and $0.2053, with an average price of around $0.1806, reflecting potential volatility due to market conditions. In 2026, CVC could fluctuate between $0.2586 and $0.3093, with an average of approximately $0.2676, signalling growing confidence in its adoption. Looking ahead to 2031, analysts foresee CVC reaching between $1.736 and $2.112, showcasing optimism in its long-term potential.
CVC historic price sentiment

- Civic Coin started 2020 below $0.05, peaking at $0.15663 in November during a market surge, but closed the year lower after notable volatility.
- In 2021, CVC reached its all-time high of $0.68165 in May, followed by sharp corrections. After a volatile market cycle, it ended the year at $0.30390 in December.
- The coin began 2022 at $0.27041 and fluctuated throughout the year, with highs of $0.20157 in June and lows around $0.06422 in August, closing the year near $0.07030.
- During 2023, CVC ranged between $0.06 and $0.21, with notable highs of $0.13430 in March and $0.21067 in November, reflecting periods of recovery and market corrections.
- In 2024, the price peaked at $0.32123 in March before declining to $0.10664 by June, stabilizing at $0.17 through August and remaining steady at $0.17-$0.19 by December.
- As of January 2025, Civic Coin has consolidated firmly within the $0.17-$0.19 range, showing stable performance with minimal volatility.

