Daily Market Review: BTC, ETH, FLOW, ENA, POPCAT
BTC
ETH
 FLOW
FLOW
 ENA
ENA
 POPCAT

The bulls are in control in today’s session, as seen from the increase in the global market cap. The total cap stood at $2.42T as of press time, representing a 1.2% increase over the last 24 hours, while the trading volume dropped by 20.3% over the same period to stand at $67.94B as of press time.
Bitcoin Price Review
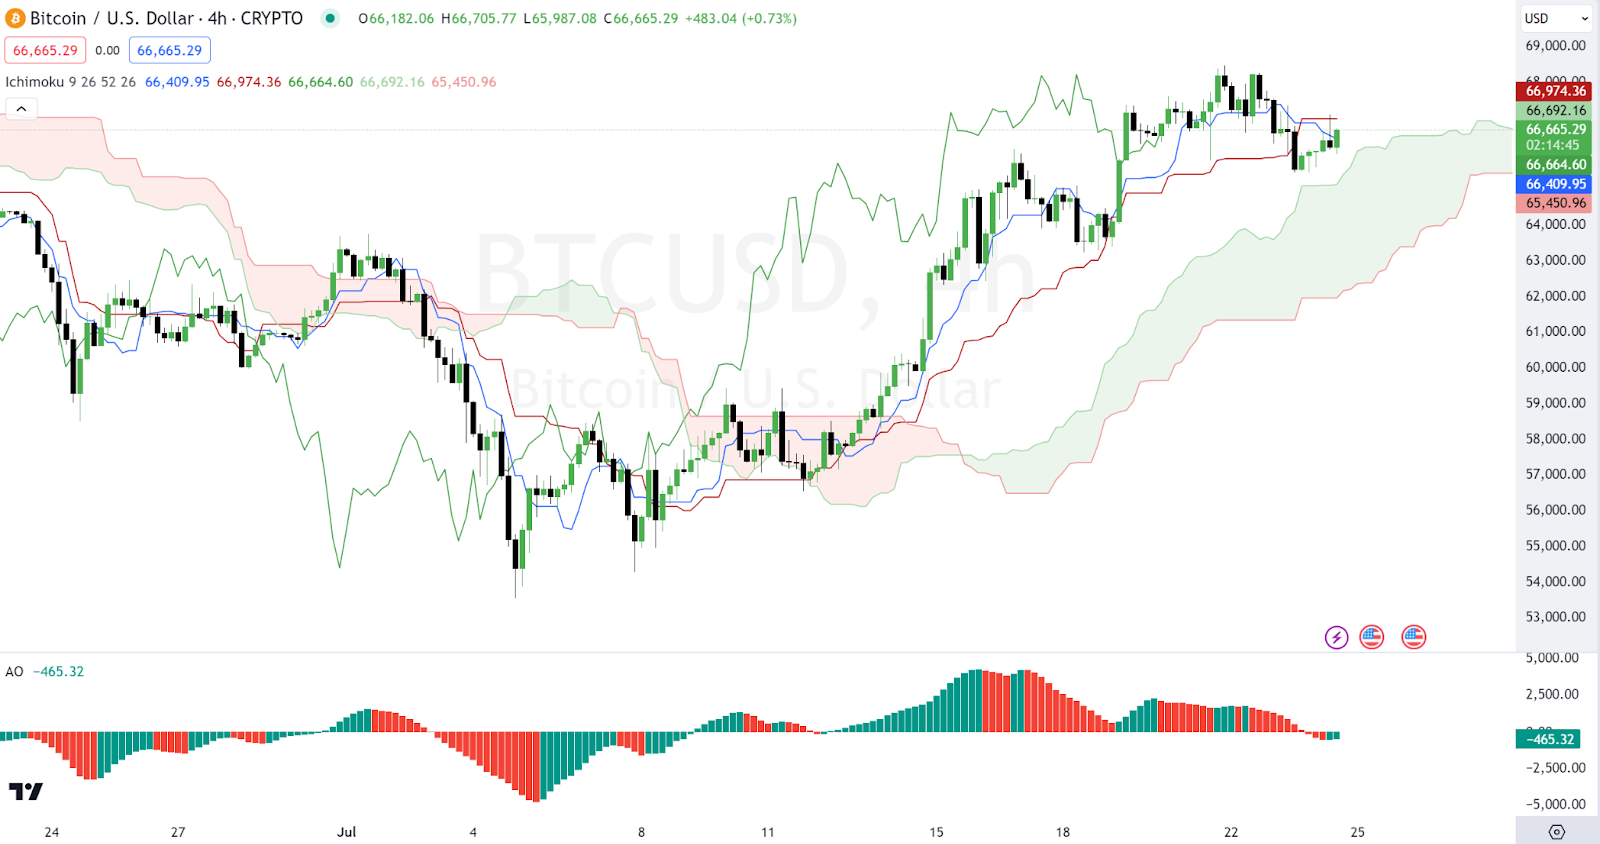
Bitcoin, $BTC, is among the gainers in today’s session, as seen from its price movements. An in-depth analysis shows the Bitcoin price is currently above the Kumo (cloud), indicating a bullish trend. The Tenkan-sen (blue line) is above the Kijun-sen (red line), suggesting bullish momentum. The Chikou Span (green line) is above the price, confirming the bullish trend.
On the other hand, the Awesome Oscillator (AO) histogram bars are green and above the zero line, indicating bullish momentum. As of press time, Bitcoin traded at $66,599, representing a 1.2% increase over the last 24 hours.
Ethereum Price Review
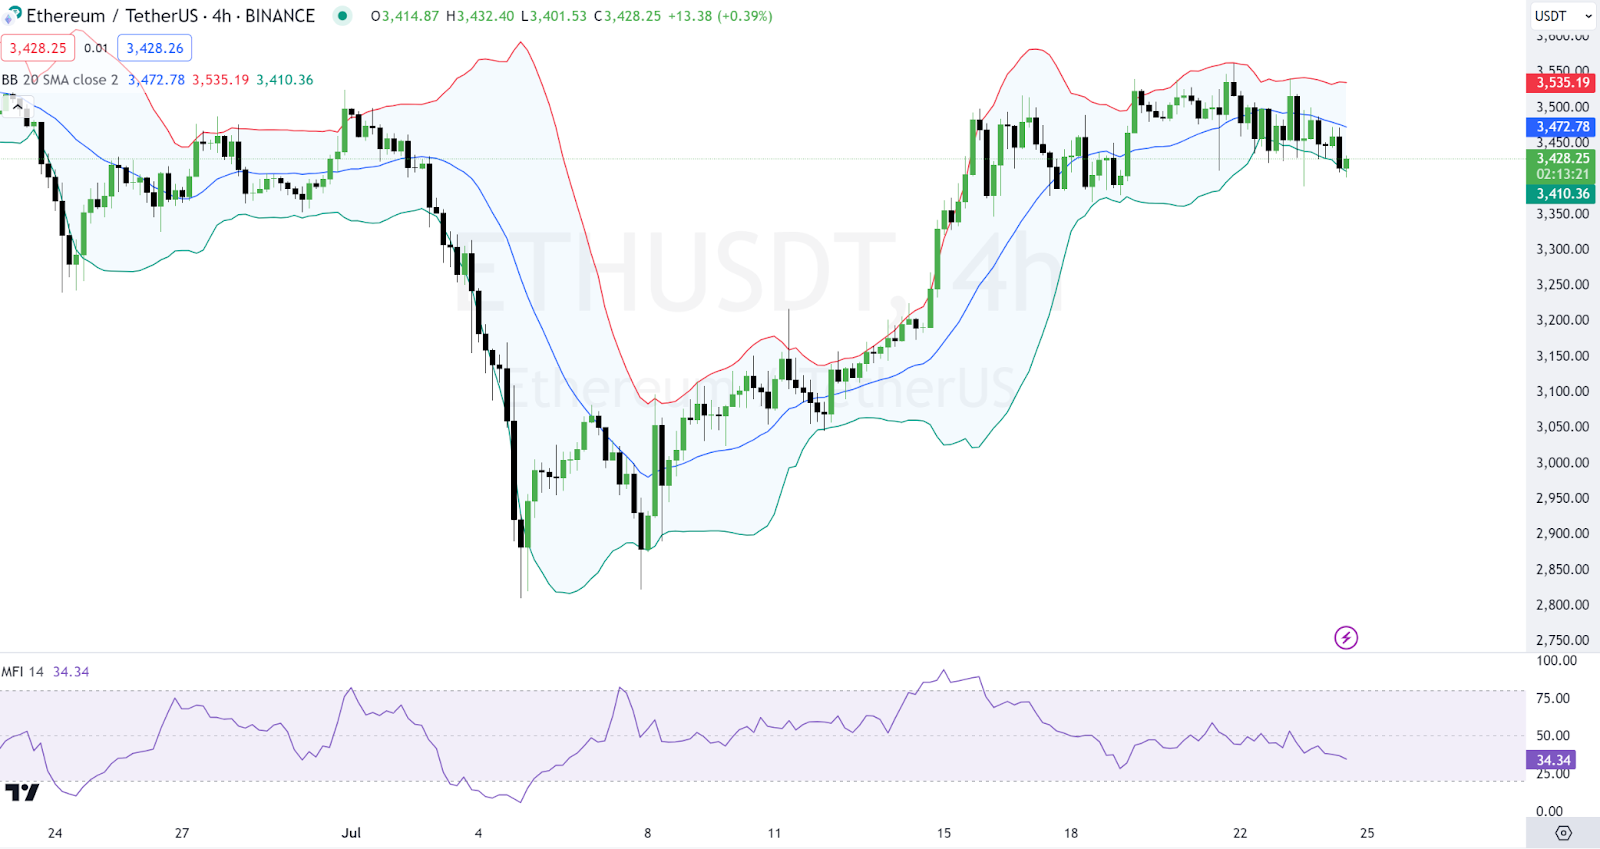
Ethereum $ETH failed to gain in today’s session, as seen from the price movements. An in-depth analysis shows Ethereum’s price is within the Bollinger Bands but slightly below the middle band (20-period moving average), indicating a neutral to slightly bearish short-term trend. The bands are relatively narrow, suggesting low volatility.
On the other hand, the Money Flow Index (MFI) is at 34.34, which is close to the oversold territory (below 20), indicating potential buying opportunities if it continues to drop. Ethereum traded at $3,417 as of press time, representing a 0.34% decrease over the last 24 hours.
Flow Price Review
Flow $FLOW is another gainer in today’s session, as seen from its price movements. An in-depth analysis shows that the three lines (Jaw—blue, Teeth—red, Lips—green) diverge upwards, indicating a developing bullish trend. The price is above all three lines, confirming the bullish momentum.
On the other hand, the Relative Strength Index (RSI) is at 88.91, indicating that the asset is overbought. Due to overbought conditions, there might be a potential correction or consolidation. Flow traded at $0.6837 as of press time, representing a 13.96% increase over the last 24 hours.
Ethena Price Review
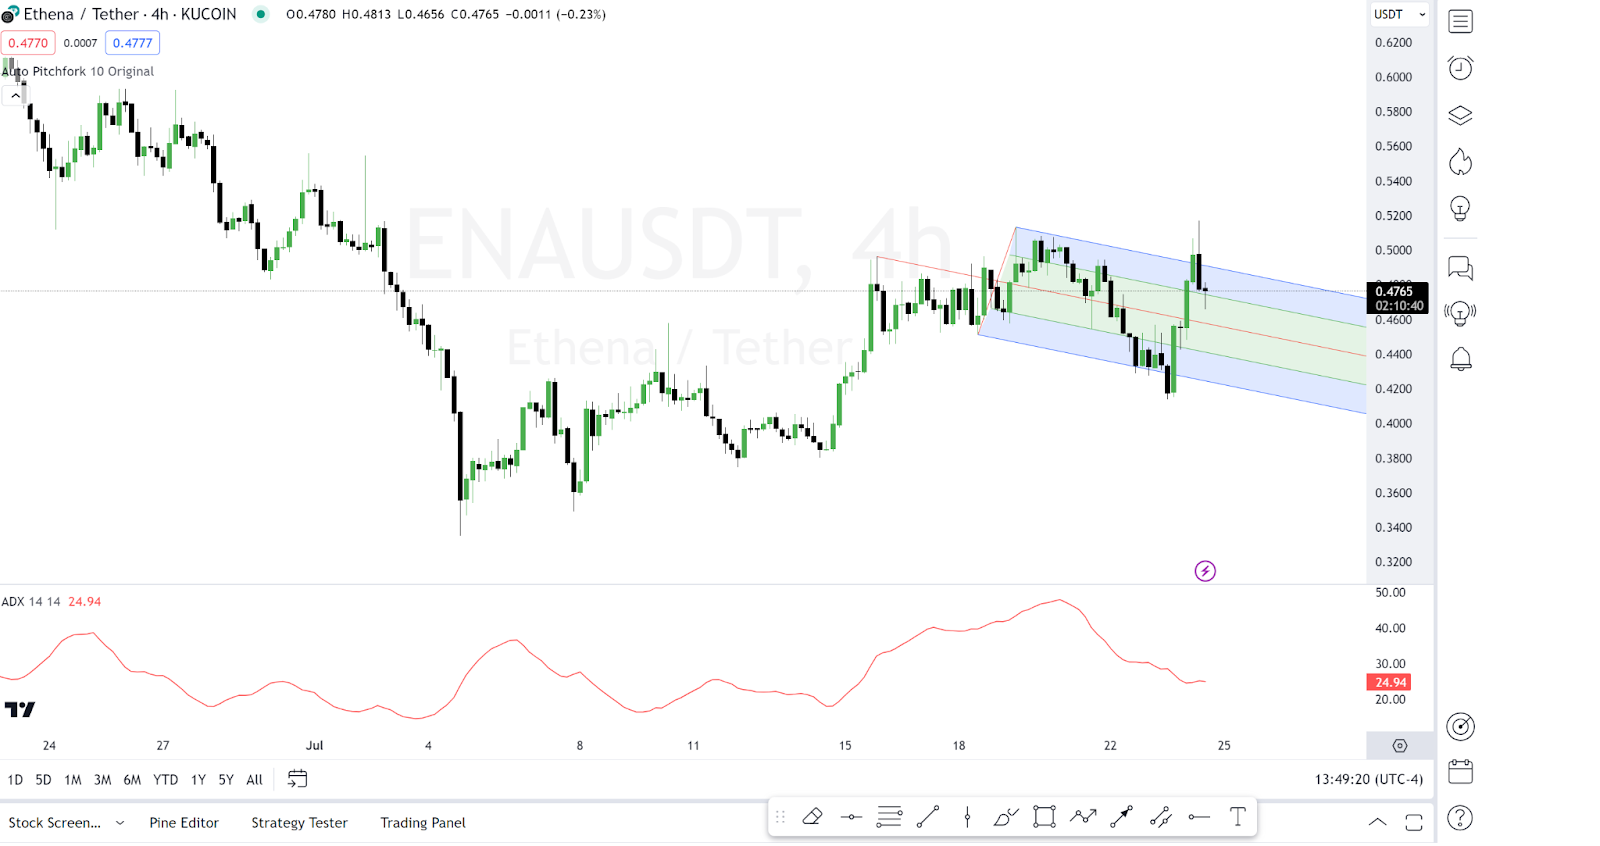
Ethena (ENA) is also among the gainers in today’s session, as seen from the price movements. An in-depth analysis shows that the Ethena price is moving within the upper half of the pitchfork channel, suggesting a bullish trend. The upper boundary of the pitchfork acts as resistance, while the median line acts as support.
On the other hand, the Average Directional Index (ADX) is at 24.94, indicating a weak trend. The ADX line is rising, suggesting that the trend might be strengthening. Ethena traded at $0.4823 as of press time, representing a 15.69% increase over the last 24 hours.

Popcat (SOL) Price Review
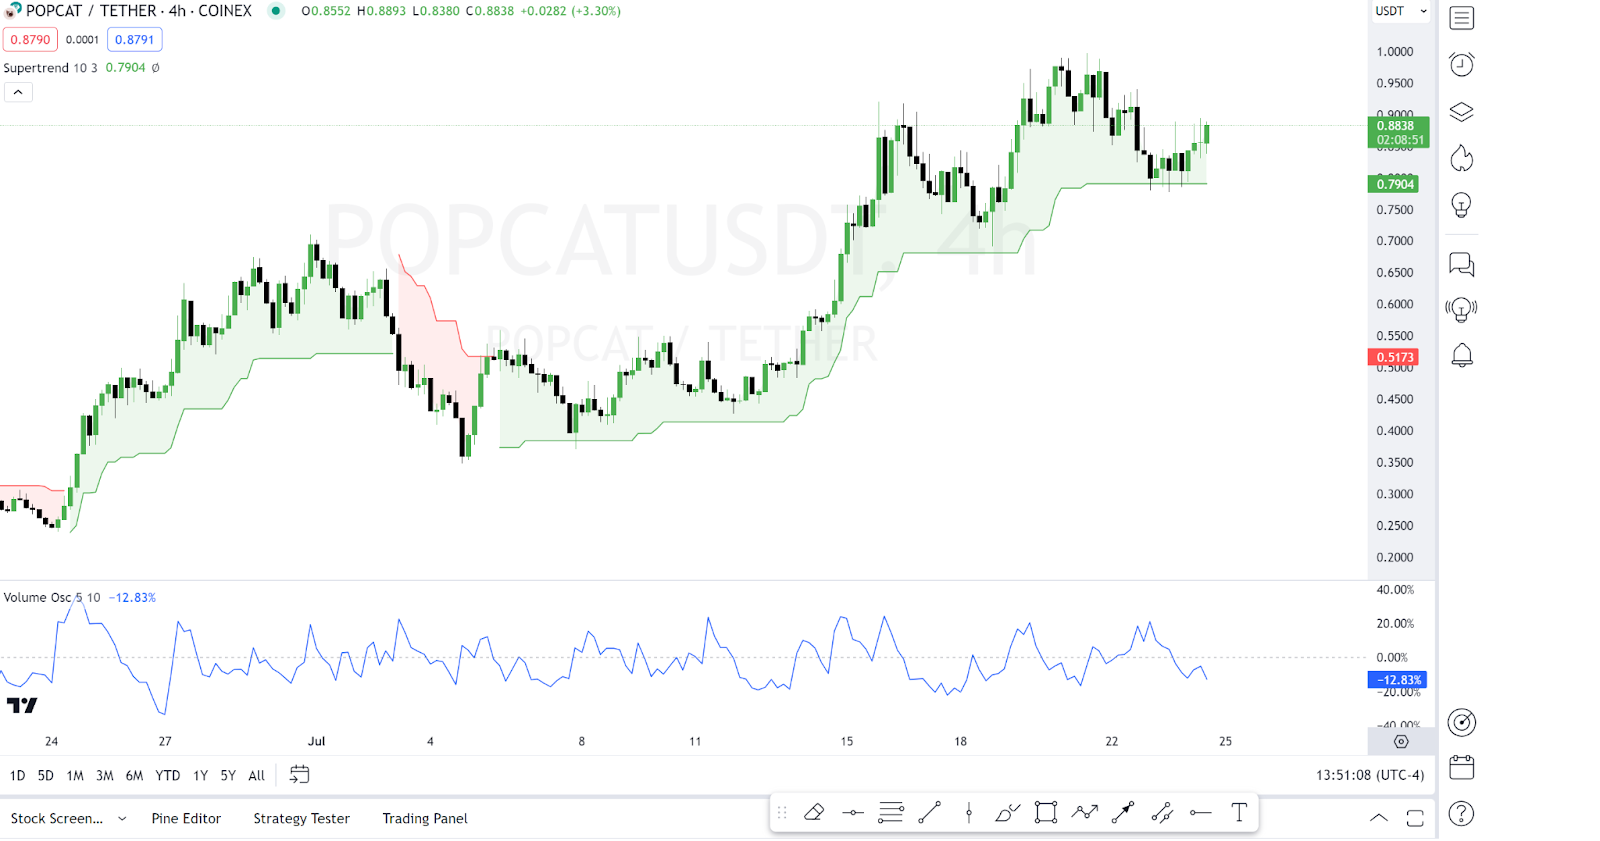
Popcat (SOL) $POPCAT is also among the gainers in today’s session, as seen from its price movements. An in-depth analysis shows that the Supertrend indicator is green, suggesting a bullish signal. The POPCAT price is above the Supertrend line, confirming the bullish trend.
On the other hand, the Volume Oscillator is at -12.83%, indicating a decrease in buying volume compared to the average. POPCAT traded at $0.8754 as of press time, representing an 11.42% increase over the last 24 hours.