


Dash price prediction 2025-2031: Is DASH recovering soon?
 CONV
CONV
 BULLISH
 VALU
BTC
VALU
BTC
 DASH
DASH
Key takeaways
- Dash price prediction for 2025 could reach a maximum value of $64.84.
- By 2028, DASH could reach a maximum price of $202.87.
- In 2031, DASH will range between $463.81 to $584.01.
Since entering the cryptocurrency space, Dash has held the attention of investors and crypto enthusiasts as a Bitcoin fork. It has been around for some years, and Dash Crypto has maintained an impressive performance all this while.
However, the price action in recent times has been unremarkable. Investors who are considering adding DASH to their crypto portfolio should ask the following questions: How high can DASH go? Will Dash (DASH) recapture its all-time high of $1,642?
Let’s get into the Dash price analysis and price predictions for 2025 – 2031.
Overview
| Cryptocurrency | Dash |
| Token | DASH |
| Price | $39.35 |
| Market Cap | $476,366,912.45 |
| Trading Volume | $88,949,350.18 |
| Circulating Supply | 12.1M DASH |
| All-time High Date | $1,642.22 (Dec 20, 2017) |
| All-time Low Date | $0.2139 (Feb 14, 2014) |
| 24-h High | $40.30 |
| 24-h Low | $36.85 |
Dash price prediction: Technical analysis
| Metric | Value |
| Price Prediction | $ 40.53 (2.99%) |
| Volatility | 6.97% |
| 50-day SMA | $ 43.31 |
| 14-Day RSI | 51.48 |
| Sentiment | Bullish |
| Fear & Greed Index | 75(Greed) |
| Green Days | 13/30 (43%) |
| 200-Day SMA | $ 29.56 |
Dash price analysis: DASH price surges to $40.30 as bullish trend peaks
TL;DR Breakdown
- Dash experienced significant upward movement.
- The overall upward trajectory suggests a positive short-term outlook for Dash, closing at $40.30.
- Dash is facing resistance at $40.40.
The Dash’s price movement for January 16th shows a rise from approximately $36.85 to $40.30, indicating a bullish trend. The price experienced steady growth with some fluctuations, reflecting increasing buying pressure. After a period of consolidation around the $39 range, Dash surged upward near the end of the timeframe, suggesting a breakout fueled by strong market sentiment or heightened demand. The token signals further potential upside if the momentum sustains, but investors should also monitor for corrections following the rapid increase.
Dash 1-day price analysis: Bullish trend with potential resistance ahead
The 1-day chart shows Dash trading at $40.37 after a recent bullish move. The price is bouncing back from its recent low of around $38.69, showing signs of recovery. The candles reflect a steady upward momentum as buyers regain control, but resistance may be seen around $44 if the trend continues.
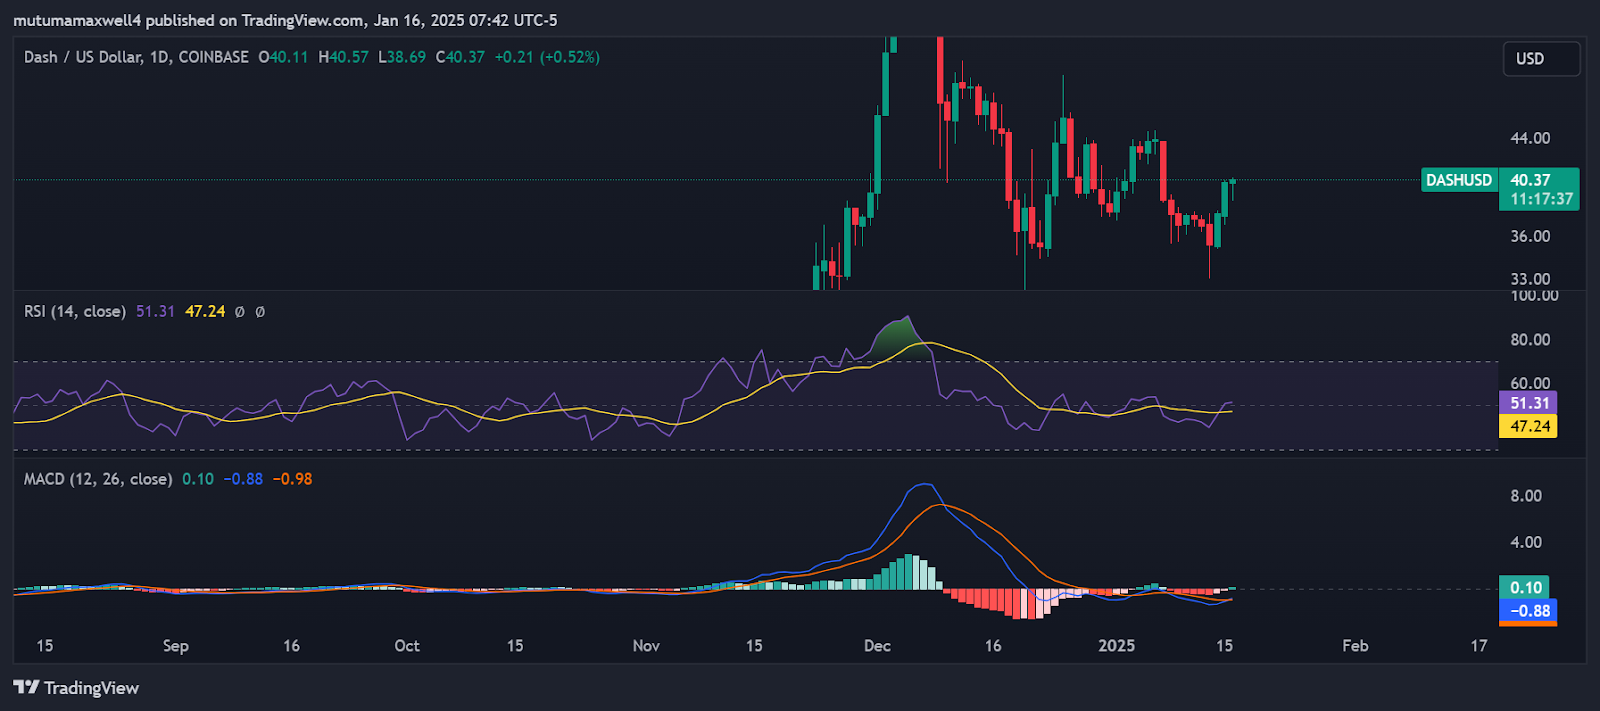
The RSI (Relative Strength Index) is at 51.31, indicating neutral momentum—neither overbought nor oversold conditions. This suggests the market could move in either direction depending on external factors or volume spikes. The MACD (Moving Average Convergence Divergence) is slightly positive (0.10) but still close to the zero line, reflecting weak but improving bullish momentum. The histogram shows diminishing bearish pressure, indicating a potential trend reversal in favor of the bulls.
DASH/USD 4-hour price analysis: Bullish momentum strengthens with RSI and MACD supporting the uptrend
The 4-hour chart shows Dash trading at $40.51, with a positive gain of 2.12% in the last session. The price is moving upward, supported by steady bullish candles, indicating increasing buyer confidence. The recent high of $41.41 suggests resistance, but the current momentum shows potential for a breakout if buying pressure persists.
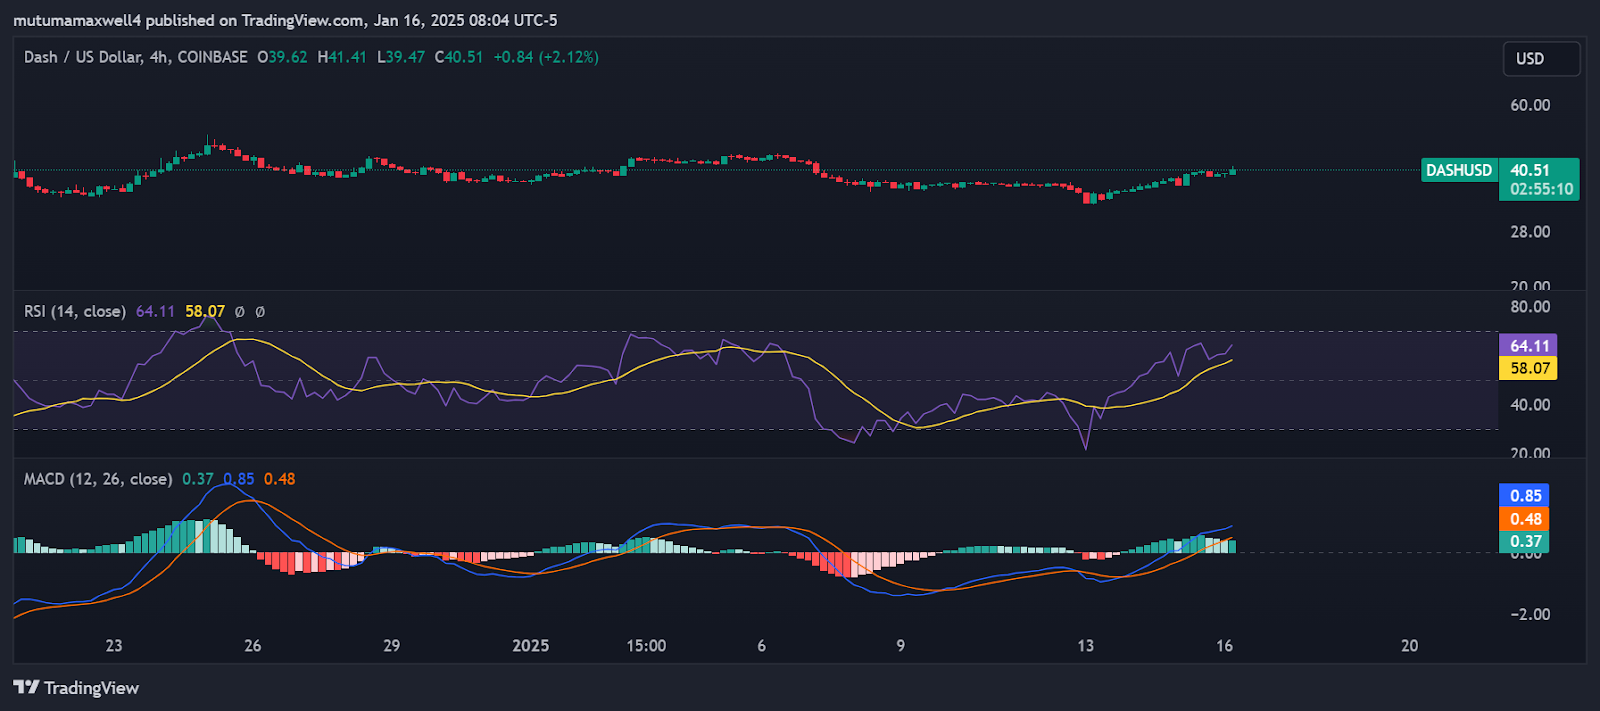
The RSI (Relative Strength Index) is at 64.11, leaning toward the overbought zone, reflecting strong bullish momentum. This suggests the price could face short-term resistance but remains in an upward trend. The MACD (Moving Average Convergence Divergence) is in bullish territory, with the MACD line (0.85) above the signal line (0.48), and positive histogram bars indicate increasing buying momentum.
Dash technical indicators: Levels and action
Daily simple moving average (SMA)
| Period | Value | Action |
| SMA 3 | $ 37.82 | BUY |
| SMA 5 | $ 37.18 | BUY |
| SMA 10 | $ 38.91 | BUY |
| SMA 21 | $ 40.05 | SELL |
| SMA 50 | $ 43.31 | SELL |
| SMA 100 | $ 34.18 | BUY |
| SMA 200 | $ 29.56 | BUY |
Daily exponential moving average (EMA)
| Period | Value ($) | Action |
| EMA 3 | $ 36.65 | BUY |
| EMA 5 | $ 37.24 | BUY |
| EMA 10 | $ 38.37 | BUY |
| EMA 21 | $ 39.71 | SELL |
| EMA 50 | $ 39.45 | SELL |
| EMA 100 | $ 36.16 | BUY |
| EMA 200 | $ 32.78 | BUY |
What to expect from Dash
Dash price analysis looks poised for a strong rally in the coming days, as both technical and fundamental factors point towards an upward trend. The bulls have managed to push the price up and break out of its current range, which could increase further in the next few hours. The technical indicators also send bullish signals, so the price could continue to increase if the buyers maintain this momentum.
Is Dash a good investment?
Dash, one of the oldest cryptocurrencies, has a strong track record and useful features like InstantSend and PrivateSend, which enhance transaction speed and privacy. These aspects make it appealing to certain users and investors.
However, investing in Dash depends on your personal risk tolerance and financial situation. Cryptocurrencies are volatile, as evident in the price trajectory of DASH, which traded above $1600 in 2017 and is now below $30. So, diversify your portfolio and only invest money you can afford to lose. Do your own research and consider consulting a financial advisor.
Will Dash recover?
Dash price shows a downward trend; recovery is uncertain without further positive market signals. Continuous monitoring of price movements and market conditions is necessary to determine potential recovery.
Will Dash reach $50?
Yes, DASH is projected to reach $50. By 2025, forecasts predict a peak price of $50, showing that Dash can potentially exceed $50 during its growth trajectory.
Will Dash reach $100?
Yes, DASH is anticipated to reach $100. According to predictions for 2027, the cryptocurrency could peak at $133.35, indicating a strong possibility of surpassing the $100 mark.
Does DASH have a good long-term future?
Dash has potential for a long-term future due to its established presence as one of the oldest cryptocurrencies. Features like InstantSend and PrivateSend enhance transaction speed and privacy, making it useful for certain users. Its successful partnerships and real-world use cases demonstrate its utility. Having traded as high as $1,600, DASH might recapture this price level in the future.
Recent news/opinion on Dash
- Dashpay announces integration with ZyptoApp
Dash price prediction January 2025
The price of DASH in January is predicted to reach a minimum value of $37.30. Traders can anticipate a maximum value of $42.40 and an average trading price of $41.22.
| Period | Minimum Price | Average Price | Maximum Price |
| DASH price prediction January 2025 | $37.30 | $41.22 | $42.40 |
Dash price prediction 2025
The price of Dash is predicted to reach a minimum value of $53.44 in 2025. The Dash price could reach a maximum value of $64.84 with an average trading price of $55.41.
| Period | Minimum Price | Average Price | Maximum Price |
| Dash price prediction 2025 | $53.44 | $55.41 | $64.84 |
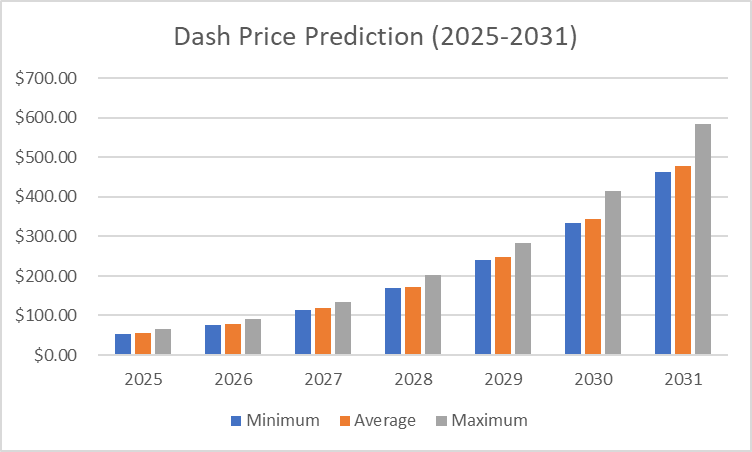
Dash price predictions 2026 – 2031
| Year | Minimum Price | Average Price | Maximum Price |
| 2026 | $76.73 | $78.95 | $92.24 |
| 2027 | $114.95 | $118.10 | $133.35 |
| 2028 | $168.57 | $173.29 | $202.87 |
| 2029 | $240.00 | $246.93 | $283.93 |
| 2030 | $332.75 | $345.10 | $414.03 |
| 2031 | $463.81 | $477.62 | $584.01 |
Dash price prediction 2026
In 2026, the price of Dash is predicted to reach a minimum level of $76.73. The DASH price can reach a maximum level of $92.24 with an average trading price of $78.95.
DASH price prediction 2027
The price of Dash is predicted to reach a minimum value of $114.95 in 2027. The Dash price could reach a maximum value of $133.35 with an average trading price of $118.10.
Dash price prediction 2028
The Dash price is forecast to reach a minimum price of $168.57 in 2028. According to the findings, it could reach a maximum possible level of $202.87, with an average forecast price of $173.29.
Dash price prediction 2029
By 2029, experts predict that DASH will start the year at $240.00 and trade around $283.93.
Dash price prediction 2030
The lowest Dash price will be between $332.75 and $414.03, and the most likely Dash price will be steady at around $345.10 by the end of 2030.
Dash price prediction 2031
In 2031, the price of Dash is expected to reach a minimum value of $463.81. It can reach a maximum value of $584.01 with an average value of $477.62.
Dash market price prediction: Analysts’ DASH price forecast
| Firm Name | 2025 | 2026 |
| Changelly | $42.99 | $63.48 |
| DigitalCoinPrice | $86.44 | $101.24 |
| SwapSpace | $43.35 | $59.94 |
Cryptopolitan’s Dash price prediction
Cryptopolitan’s Dash analysis suggests the token’s minimum price will rise to $53.44, an average of $55.41, and a maximum of $64.84 in 2025. Looking ahead, our predictions for 2026 indicate more significant growth, with the token’s price ranging from $76.73 to $92.24.
Dash historic price sentiment
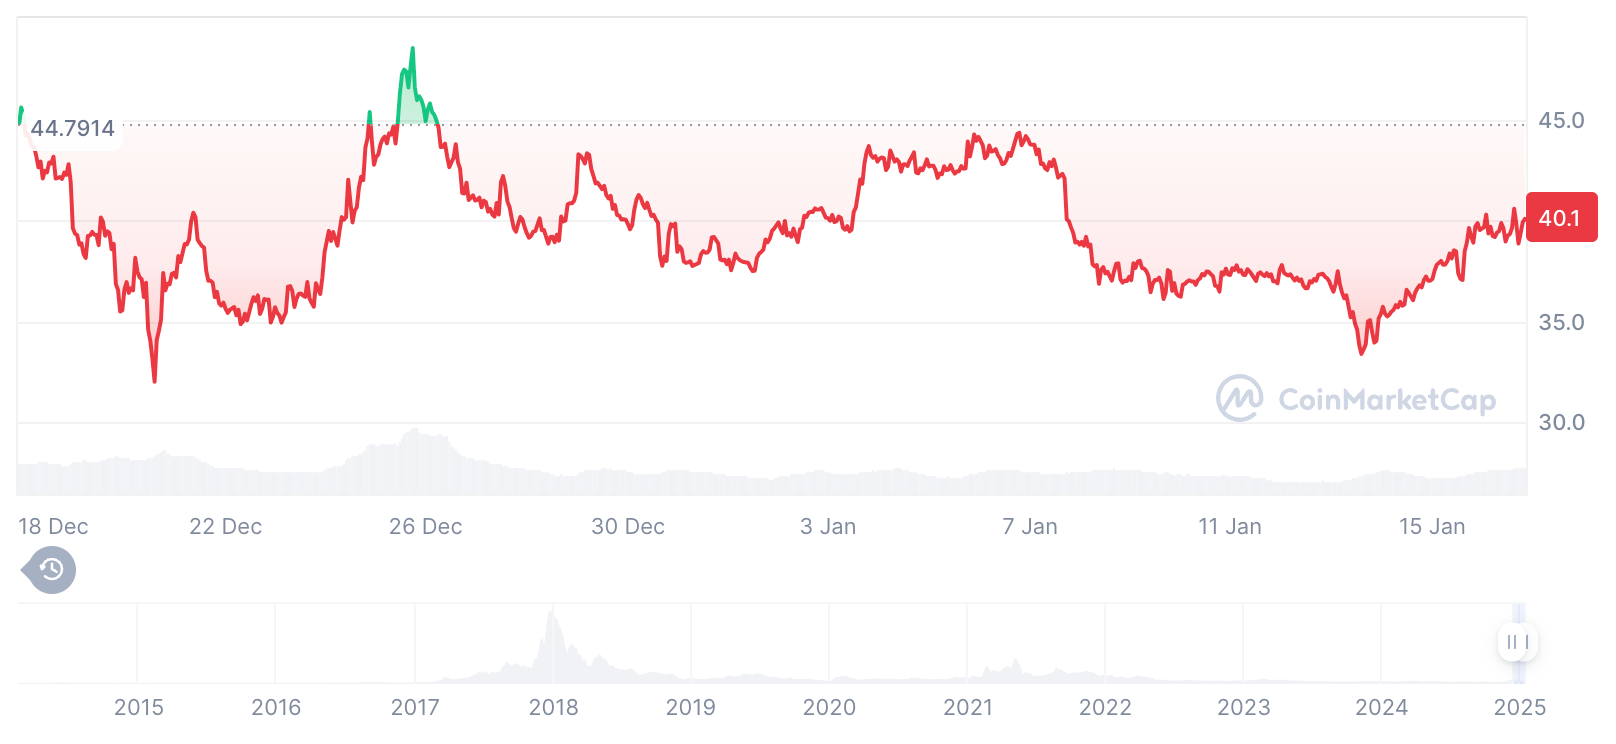
- Dash, launched in January 2014, initially traded below $1 per coin. It gained attention for its innovative two-tier network featuring miners and masternodes.
- During the 2017 cryptocurrency bull run, Dash’s price surged, reaching an all-time high of approximately $1,642 in December 2017. Following this peak, the market experienced a correction, and by the end of 2018, Dash’s price had fallen significantly.
- In 2020, as the cryptocurrency market began to recover, Dash’s price increased to above $150, though it did not return to its previous all-time high.
- In 2021, Dash experienced more significant price recoveries, reaching a peak price of $478. However, at the turn of 2022, the entire market was hit by a bearish wave, which took DASH to as low as $30.60.
- In 2023, Dash started the year at around $42.05, peaked at $77.21, and hit a low of $22.60 before closing the year at $31.78.
- In 2024, Dash saw fluctuations, with a high of $71.01 and a low of $19.23, ending the year at $37.91.
- As of January 2025, it’s trading at approximately $40.01, showing a slight recovery.
