Key Highlights ETH is trading at $2,091.14 (−1.36% 24h) as staking ratio climbs to 36.32% of total supply Ethereum 2.0 Staking Rate rose ~4.32% since May even as ETH price fell from ~$2,800 i
Key Highlights
ETH is trading at $2,091.14 (−1.36% 24h) as staking ratio climbs to 36.32% of total supply
Ethereum 2.0 Staking Rate rose ~4.32% since May even as ETH price fell from ~$2,800 in October, per CryptoQuant analyst PelinayPA
Total Staking Inflow declined 40.11% — existing validators holding firm, but new staking activity is decelerating
Supply-side signal activates as a price catalyst only if demand-side absorption materializes at current levels
Ethereum is trading at $2,091.14 — down 1.36% in the past 24 hours — while an on-chain divergence is quietly building beneath the price chart. As ETH has declined from roughly $2,800 in October to current levels, the percentage of total ETH supply committed to staking has continued to climb. That divergence is not a bullish call. It is a supply-side structural observation, and it carries real implications for how liquid ETH behaves when demand eventually returns.
An on-chain analyst at CryptoQuant, publishing under the handle @PelinayPA, identified the divergence in a Quicktake note dated November 9, 2026. Her conclusion, quoted directly by CryptoQuant: “While prices move lower, staking participation continues to increase, suggesting that investors have not significantly reduced their commitment to staking.” The report does not set a price target. It documents a structural condition — and that distinction matters.
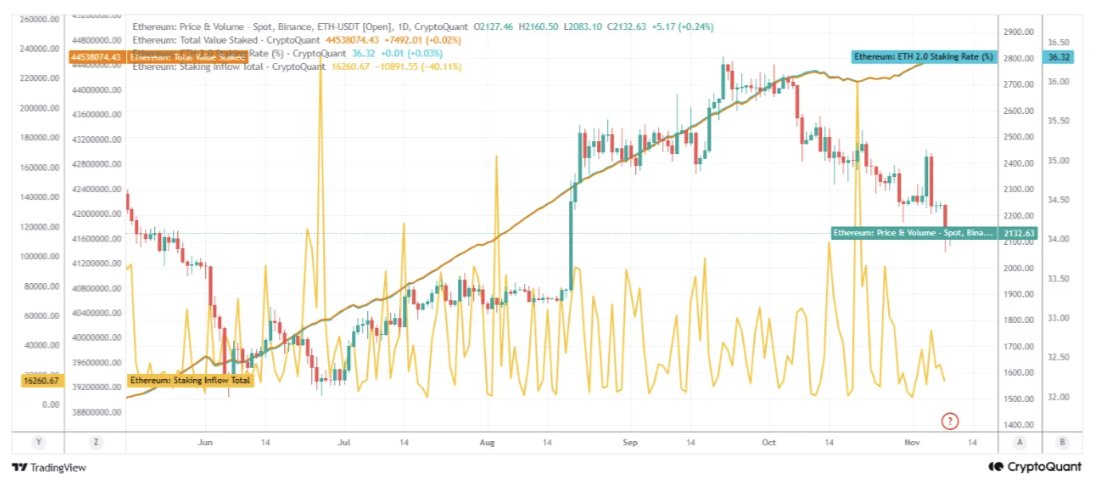
Ethereum 2.0 Staking Chart Analysis | Source: @cryptoquant_com (X)
According to CryptoQuant’s published analysis, the Ethereum 2.0 Staking Rate has increased by approximately 4.32% since May 2024. At the time of publication, approximately 36.32% of ETH’s total supply is currently staked — meaning more than one-third of all existing ETH is locked in validator positions and not freely available for trading. The staking rate has risen from roughly 32% in May to that current level across a six-month window, a steady grind upward that did not pause when ETH’s Binance price fell from approximately $2,800 in October to $2,132 at the time of the report.
The chart shared by CryptoQuant illustrates this clearly. The gold staking line trends steadily upward throughout the entire period from May through mid-November 2024, while ETH’s price formed a rising structure peaking in late September and early October before entering a descending sequence of lower highs. The two lines move in opposite directions — price declining, staking participation rising — producing the divergence that the analyst flags as the central finding.
What this means structurally: a larger share of total ETH supply being committed to staking reduces the pool of ETH available for open-market selling. As the analyst notes, “higher staking participation may reduce liquid ETH available for selling, potentially supporting prices when demand remains strong.” The word “potentially” carries weight here — the analyst is describing a condition, not predicting an outcome.
The CryptoQuant report makes an important internal distinction that most commentary on staking data misses. Total Staking Inflow has declined by 40.11% — meaning the daily rate of new ETH entering staking contracts has slowed sharply, even as the cumulative total staked continues to grow. The analyst flags this directly: “This highlights the importance of distinguishing long-term staking growth from daily inflow activity.”
In plain terms: the stock of staked ETH is rising, but the flow of new staking is decelerating. These are two separate signals. A falling inflow rate alongside a rising total staked balance means existing stakers are not exiting — but fewer new validators are entering. That is a picture of conviction among existing holders, not necessarily a picture of growing fresh demand for ETH exposure.
The analyst also adds a critical caveat that should not be lost: “staked ETH should not be considered permanently locked, as validators can initiate withdrawals.” The supply reduction is real but conditional. If sentiment deteriorates sharply, the unstaking queue can clear, returning that ETH to the tradable float. The 36.32% staking ratio is a friction on supply, not a permanent lock.
This nuance matters for anyone reading staking data as a pure bullish signal. It is not that. It is a supply-side observation with a medium-to-long-term time horizon, as the analyst concludes: “Ethereum maintains a potentially supportive supply-side dynamic in the medium to long term.”
Notably, this comes in a broader context where institutional flows have faced pressure — Bitcoin and Ethereum ETFs bled $348.9M in a single day in mid-October, illustrating that demand-side headwinds remain real even as on-chain supply data firms up.
The analyst’s conclusion is carefully framed: “If the market can absorb selling pressure and attract sufficient demand during this correction, ETH could establish the foundation for a stronger upward trend.” This is an if/then structure, and both halves matter.
The supply-side condition is already in place: 36.32% of ETH staked, inflows declining but total staked growing, existing validators not exiting. What is not yet in place is the demand-side absorption. The price chart shows lower highs since October — the market has not yet demonstrated that it can hold the selling pressure the analyst references.
This is not an unusual setup for Ethereum. The asset has previously exhibited extended periods where on-chain supply metrics strengthened ahead of price recovery, but the timing between those two legs has historically been difficult to pinpoint. The CryptoQuant note does not attempt to pinpoint it here, and that intellectual honesty is worth preserving in any reading of this data.
For broader context on on-chain signals and what actually drives recoveries, a parallel analysis of Bitcoin’s rebound failures offers a useful reference point — the demand-side confirmation requirement is structurally similar.
ETH is at $2,091.14. The staking ratio stands at 36.32% — up approximately 4.32% since May. Total staked ETH has risen to 44,538,074 ETH. Daily staking inflows have dropped 40.11%, meaning fewer new validators are entering but existing ones are holding. Price has fallen from roughly $2,800 in October while each of those staking metrics moved in the opposite direction.
CryptoQuant’s on-chain analyst characterizes this as investor confidence remaining intact at the structural level, even as price-level conviction has weakened. The supply-side dynamic is supportive in the medium to long term — but only activates as a price catalyst if demand-side absorption materializes. Watch ETH’s ability to hold current levels and reverse the pattern of lower highs: that is the demand-side confirmation the analyst’s thesis requires before the supply reduction can translate into price support.
Disclaimer: The views and analysis presented in this article are for informational purposes only and reflect the author’s perspective, not financial advice. Technical patterns and indicators discussed are subject to market volatility and may or may not yield the anticipated results. Investors are advised to exercise caution, conduct independent research, and make decisions aligned with their individual risk tolerance.
Also Read: Bitcoin STH-SOPR Falls Below 1.0 — What Declining Exchange Inflows Signal.