


Ethena (ENA) Signals Rebound as Key Indicators Point to Trend Reversal
 CONV
CONV
 BULLISH
 CVG
CVG
 ENA
ENA
 RVL
RVL
- The TD Sequential indicator signals a potential rebound for Ethena as a red "9" suggests the downtrend may be weakening.
- Ethena has tested the $0.45-$0.50 support multiple times, with an Inverted Hammer indicating a possible bullish reversal.
- The MACD indicator shows bearish momentum fading, with a possible bullish crossover that could confirm a trend shift.
Ethena (ENA) is displaying early signs of a potential recovery as technical indicators suggest the downtrend may be weakening. The asset's price has hovered around $0.4615, reflecting a 1.29% decline in the last 24 hours and an 8.26% drop over the past week. Traders are closely monitoring key support levels and bullish signals that could determine the next move.
TD Sequential Indicator Flashes Buy Signal
Crypto analyst Ali_charts shared insights on Ethena’s price action, noting that the TD Sequential indicator has triggered a buy signal on the 12-hour chart. The appearance of a red "9" suggests that the recent downtrend could be reaching exhaustion. Additionally, a black upward arrow above the latest candle indicates a possible shift in momentum.
Price action on the chart reveals alternating bullish and bearish movements, with a major bearish candle around February 11, followed by a minor pullback and gradual price increase. The most recent candle shows upward momentum, reinforcing the TD Sequential’s buy signal. If the asset breaks above the $0.47 resistance level, further upside movement could follow.
Support Levels and Bullish Reversal Indications
Ethena has found support at $0.45-$0.50, an area previously tested several times. The level has held steady despite recent price oscillations. Resistance still lies at $1.20, the level previously seen by the highs before the fall.
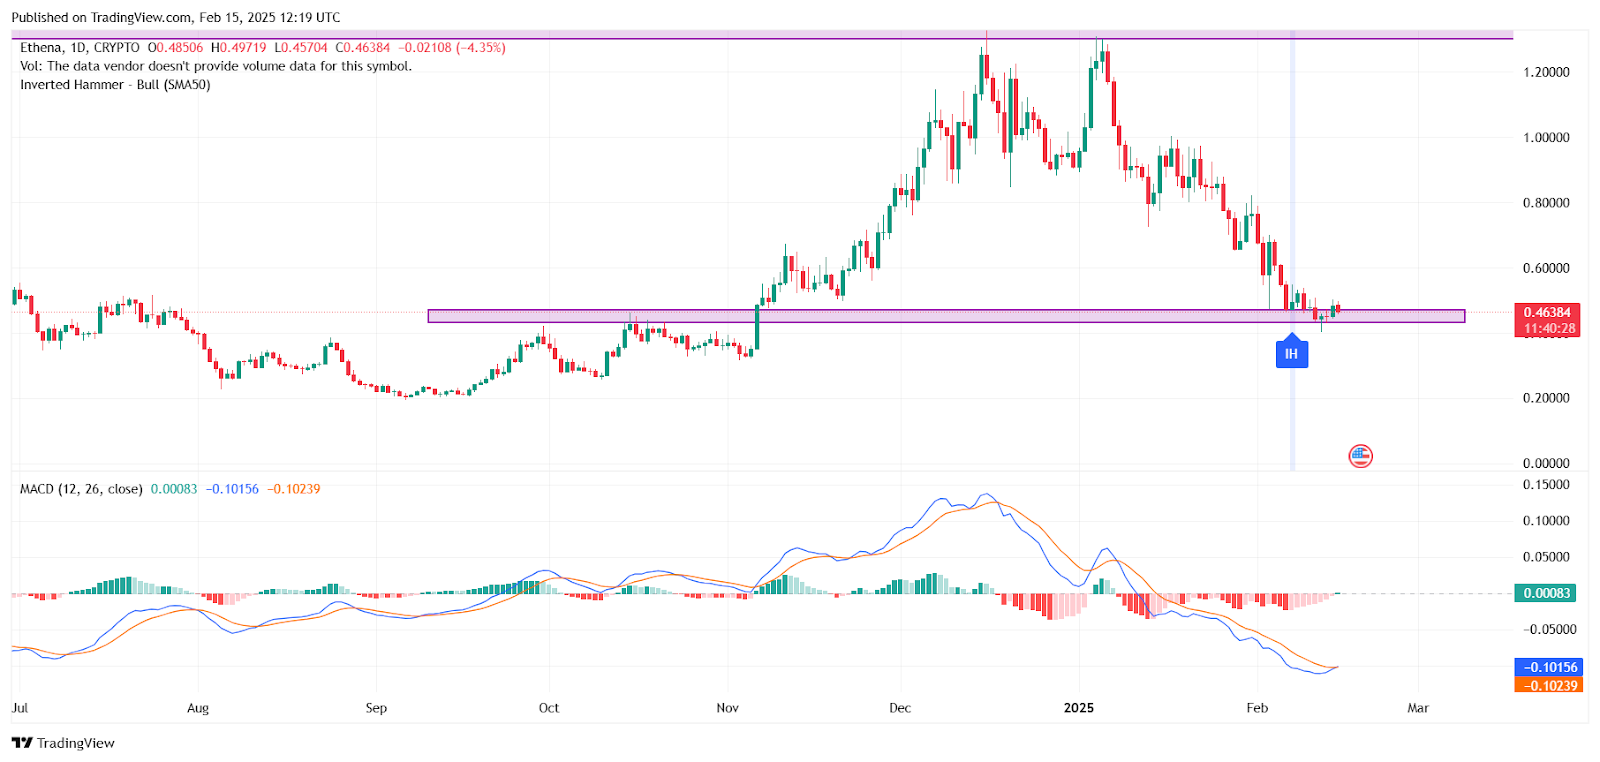
A technical signal, an Inverted Hammer, has also occurred at the support level, signaling a potential reversal. The long upper wick indicates buyers drove prices up, but there has still been resistance. If there are indications of bullish strength in the next sessions, there could be a reversal.
MACD Suggests Potential Momentum Shift
The Moving Average Convergence Divergence (MACD) indicator shows momentum change. The MACD line is sloping upwards, converging toward a crossover with the signal line. The histogram bars also reverse less bearish, showing bearish momentum losing power. A bullish crossover by the MACD also shows the change in trend.
If buyers sustain momentum, supporting price over $0.50, there may be an attempt toward $0.60 to $0.80. A break below $0.45 support, on the other hand, may lead back toward the lows near $0.30 to $0.35. Traders expect confirmation of these indicators before charting the next course for Ethena.
The post Ethena (ENA) Signals Rebound as Key Indicators Point to Trend Reversal appears on Crypto Front News. Visit our website to read more interesting articles about cryptocurrency, blockchain technology, and digital assets.
