Ethereum (ETH) hovers within the $1.7K range. The buyers control the broader market structure. Two notable institutions have pulled significant Ethereum off exchanges within the same hour. A
- Ethereum (ETH) hovers within the $1.7K range.
- The buyers control the broader market structure.
Two notable institutions have pulled significant Ethereum off exchanges within the same hour. A wallet tied to K3 Capital withdrew 10,000 Ethereum worth $17.85M from Binance, while Abraxas Capital followed with 6,948 ETH valued at $12.42M pulled from both Binance and Bitfinex. That is nearly $30M in Ethereum moved off exchanges.
When institutions withdraw tokens from exchanges, they are not selling; they are moving them into cold storage or private custody, hinting at accumulation behaviour. It infers the plan to hold, not trade. Every ETH pulled off an exchange shrinks the available supply that traders can actually buy or sell.
Less supply on exchanges with steady or growing demand pushes the price up. For the asset’s price trajectory, consistent institutional withdrawals at these levels build a solid floor. Moreover, there will not be a price spike overnight, but it signals that the money sees current levels as a buying opportunity rather than a danger zone.
Currently, Ethereum (ETH) has recorded a modest loss of over 1.13%, hovering at $1,780. The daily high of the asset is noted at around $1,842. Assuming the drop in value gets deeper, the Ethereum price might slip to the support at $1,724. If it fails to hold this level, more losses could follow. Upon a recovery, the ETH price could climb to the resistance at $1,841. With the bulls breaking this range, the pressure on the upside triggers the price to move higher.
Ethereum Outlook: Buyers or Sellers in Charge?
The ETH/USDT trading pair’s technical setup indicates consolidation. As the Moving Average Convergence Divergence and signal lines sit above the zero threshold, the long-term momentum remains positive. Also, the buyers control the broader market structure.
Traders are likely taking profits, causing a temporary dip or sideways grind. It is generally not a signal to panic-sell, but rather a sign to wait for the MACD line to flatten out and curl back above the signal line to confirm the next leg higher.
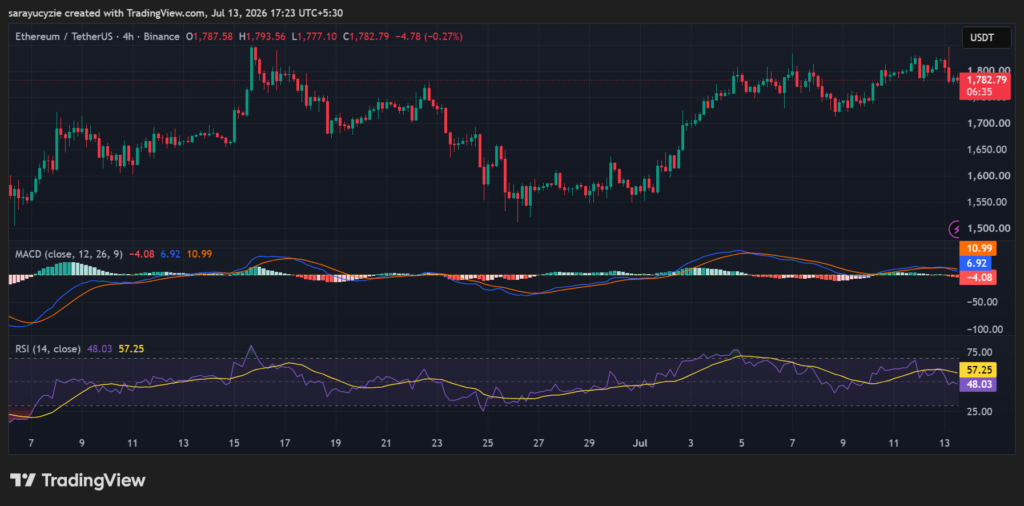 (Source: TradingView)
Moreover, Ethereum’s daily Relative Strength Index reading settled at 48.03, suggesting its neutral state. The asset is trading in the middle of the momentum scale; neither the bulls nor the bears have control.
The price is likely chopping sideways, consolidating, or resting after a previous move. Strategic traders keep their hands off until the indicator breaks above 50 to confirm a bullish push, or slides below 45 to indicate a bearish breakdown.
Crypto Market Highlights
PI Nears the Crucial Squeeze: The Ultimate Reversal Setup the Market Is Watching