


Is XRP Price Forming a Bottom? Watch These Key Price Levels This Week
 CRYPTO
 X
X
 X
X
 XRP
XRP
 X
X
XRP price is back on traders’ radar as it tries to bounce from its recent lows. There’s talk of a potential reversal, but everything hinges on how this week’s candle closes.
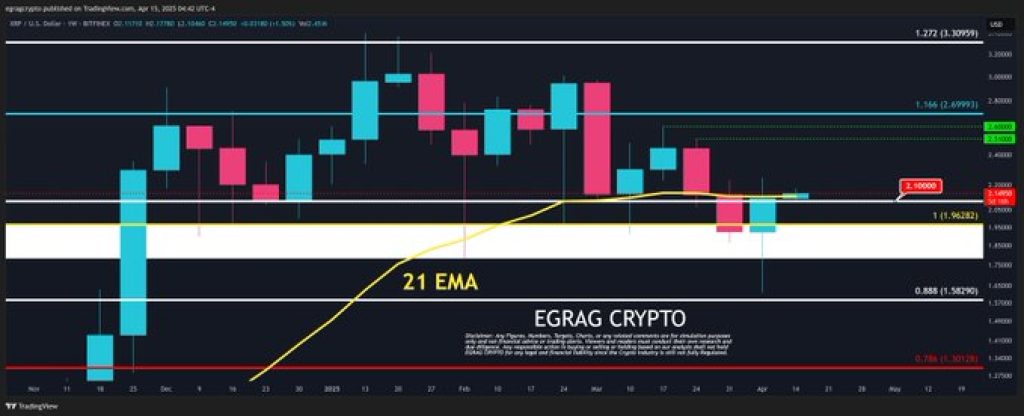
Top analyst EGRAG CRYPTO shared on X (formerly Twitter) a chart highlighting the key levels everyone’s watching. One of the main indicators in focus is the 21-week EMA, a trend line that often signals whether momentum is shifting. In his post, he broke down exactly what needs to happen for April 7 to be confirmed as XRP’s bottom.
XRP Price Attempts to Reclaim the 21-Week EMA
The XRP/USDT chart on the weekly timeframe shows that the asset is currently trading above the 21-week EMA. This moving average is viewed by many market participants as a key trend indicator. A close above it often suggests momentum could shift in favor of buyers.
The current candle is attempting to close above three major levels: the 21 EMA, the $2.10 price mark, and a resistance level near $2.25. EGRAG CRYPTO stated that achieving these conditions would confirm that April 7 marked a bottom. The XRP price has also bounced off a historical support zone, marked by a thick white band between approximately $0.57 and $0.62.
XRP Resistance and Support Zones on the Weekly Chart
XRP price is now testing a short-term resistance at $0.62900. A successful close above this level could open the path toward the next Fibonacci extension levels at $0.69995 and $1.09995. The chart also shows a long-term target at $1.30999, corresponding to the 1.272 Fibonacci level.
On the downside, if the price fails to maintain above $0.60, the next support is the 1.0 Fibonacci level at approximately $0.58243. If that does not hold, the next zone to monitor is the 0.886 level near $0.54870, which could act as a final support before further downside.
Read Also: SEI at Launch Price Again — Buy Zone or Trap? Here’s What the Data Shows
XRP Market Structure and Historical Reference
The analyst drew a comparison to earlier market cycles, suggesting that failure to hold above the identified levels could lead to renewed bearish narratives. The reference to “tariff issues” and past regulatory events in 2013 appears to highlight the kind of uncertainty that may follow if the current structure breaks down.
While market sentiment remains cautious, the weekly close remains the key factor. Until a full-bodied candle closes above the mentioned levels, the outlook remains neutral. Traders and analysts will continue monitoring whether XRP price can flip resistance into support and maintain strength above the 21-week EMA.
Follow us on X (Twitter), CoinMarketCap and Binance Square for more daily crypto updates.
Get all our future calls by joining our FREE Telegram group.

We recommend eToro
Wide range of assets: cryptocurrencies alongside other investment products such as stocks and ETFs.
Copy trading: allows users to copy the trades of leading traders, for free.
User-friendly: eToro’s web-based platform and mobile app are user-friendly and easy to navigate.
The post Is XRP Price Forming a Bottom? Watch These Key Price Levels This Week appeared first on CaptainAltcoin.
