Kaspa spent most of October squeezed inside a narrowing pattern, and the way that squeeze ended matters more than the pattern itself. A fresh chart from an analyst on X shows where KAS trades
Kaspa spent most of October squeezed inside a narrowing pattern, and the way that squeeze ended matters more than the pattern itself. A fresh chart from an analyst on X shows where KAS trades now and where the next major level could appear. The daily indicators add a few more clues worth checking.
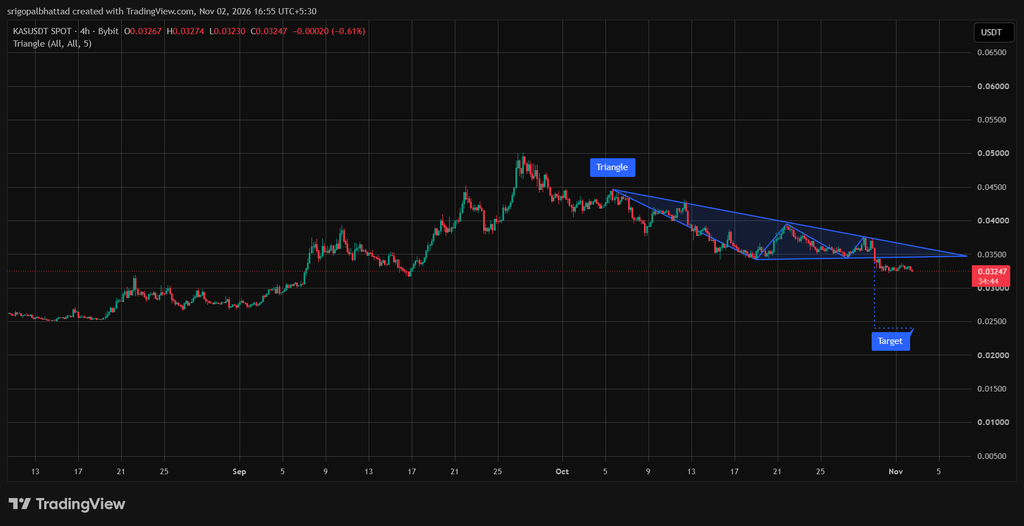
Crypto With Gopal shared a KASUSDT spot chart from Bybit on the 4H timeframe, drawn on TradingView on Nov 2, 2026. The chart marks a triangle that starts near $0.0445 in early October. A descending resistance line connects a series of lower highs, while a flat support line runs near $0.0345.
The analyst described it as a symmetrical triangle and called it a major battle between bulls and bears. These are the main points on the chart:
- Early October high near $0.0445 starts the descending resistance line
- Lower highs near $0.0430, $0.0395, and $0.0375 follow over the next few weeks
- Flat support near $0.0345 gets tested more than once before the pattern ends
@cryptowithgopal / X
Kaspa Price Has Already Dropped Below the Triangle Support
The chart shows that the squeeze ended to the downside in late October. A large red candle pushed KAS from near $0.0375 to roughly $0.0325, which put the price below the flat support line. Trading has stayed in a tight sideways range since that move.
The latest 4H candle on the chart opened at $0.03267 and reached a high of $0.03274. It dipped to $0.03230 and closed at $0.03247, a decline of 0.61%. Crypto With Gopal quoted the same $0.03247 price in his post.
The old triangle floor near $0.0345 to $0.0350 now acts as resistance. The analyst marked a support zone around $0.0320 to $0.0325 and said bears hold the short term edge. A reclaim of $0.0350 would weaken that view.
Level
Price
Role
Resistance
$0.0350
Old triangle support, now a ceiling
Current price
$0.03247
Trading below the broken pattern
Support
$0.0320 to $0.0325
Zone the analyst is watching
Target
$0.0230 to $0.0240
Downside objective after the breakdown
Kaspa Price Target Zone Is Close to Mid-August Trading Levels
The chart draws a target box near $0.0240, and the analyst’s text mentions $0.0230. A drop to that area would mean a decline of roughly 26% to 29% from $0.03247. That zone is close to the $0.0250 to $0.0265 range where KAS traded in mid-August, before the September rally began.
That rally pushed KAS close to $0.0500 in late September. The current price of $0.03247 is roughly 35% below that peak. The chart therefore shows a coin that has given back a large part of its summer gains.
The 4H chart is only one view of the market. The daily chart on Investing.com adds five more readings, and most of them lean the same way.
Indicator
Value
Action
RSI(14)
33.857
Sell
STOCH(9,6)
7.549
Oversold
MACD(12,26)
-0.002
Sell
Ultimate Oscillator
35.218
Sell
Bull/Bear Power(13)
-0.0050
Sell
RSI(14) at 33.857: The reading is well under the neutral 50 mark and close to the 30 level that marks oversold territory. Buying strength is weak on the daily chart.
STOCH(9,6) at 7.549: This is deep oversold territory. It confirms that KAS has been closing near the bottom of its recent range. A short bounce can follow readings like this, but they also show how heavy the selling has been.
MACD(12,26) at -0.002: A negative value means the short term average is below the longer term one. That matches the downward drift visible on the 4H chart.
Ultimate Oscillator at 35.218: This tool blends momentum across three timeframes. A reading in the mid 30s means weakness appears across short, medium, and longer periods.
Bull/Bear Power(13) at -0.0050: A negative value means bears have been stronger than bulls over the last 13 periods. It lines up with the analyst’s comment about the short term edge.
Four of the five indicators carry a sell label, and the fifth is oversold. That mix supports the bearish chart, even if a short relief bounce appears first.
Read Also: Bitcoin, Ethereum and XRP Sentiment Is Collapsing, But There’s a Catch
What Could Happen Next for KAS: Continued Drop or Recovery Above $0.0350
Two paths remain open for the Kaspa price from here.
- Continued drop: A move below the $0.0320 to $0.0325 support zone would open the road toward the $0.0230 to $0.0240 target area.
- Recovery: A climb back above $0.0350 would put KAS back inside the old triangle and weaken the breakdown.
Broken patterns are sometimes retested before the next move, so a bounce toward $0.0345 would not be unusual. Traders often watch whether that level holds as resistance.
Subscribe to our YouTube channel for daily crypto updates, market insights, and expert analysis.
The post Kaspa Price Could Be Setting Up for a Bigger Drop! appeared first on CaptainAltcoin.