


Marlin (POND) Price Analysis: Key Levels to Watch on January 24, 2025
 RES
RES
 POND
POND
 CIN
CIN
- POND struggles below $0.0244 resistance, with bearish momentum dominating January 2025.
- Key support holds at $0.0181, with potential downside toward $0.016 if broken.
- Consolidation persists as price trades near critical EMAs, reflecting market uncertainty.
The price of Marlin (POND) shows a mix of trends this January, creating challenges for both traders and investors. While short-term indicators hint at potential rebounds, the overall trend remains under bearish pressure.
Resistance and Support Levels Shape the Trading Range
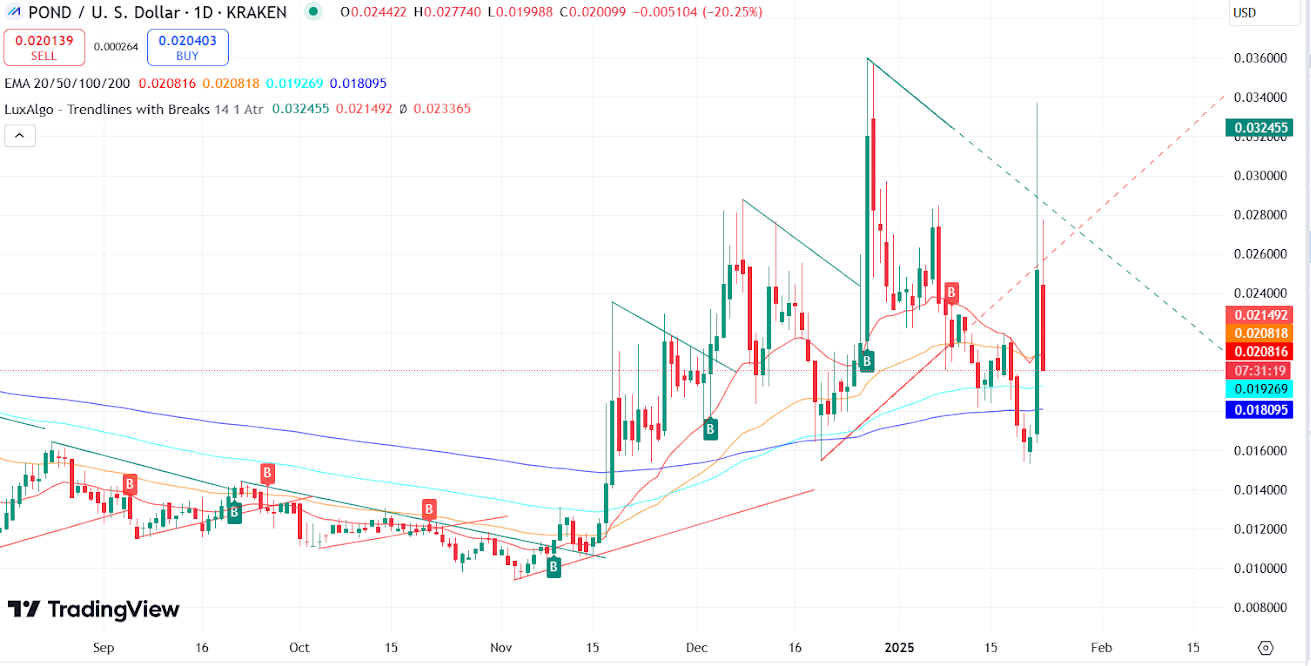
The daily chart shows POND is trading near critical exponential moving averages (EMAs). The 20-day and 50-day EMAs act as immediate resistance, with the price staying well below the 200-day EMA—an indicator of continued bearish momentum. Resistance levels are noted at $0.0244 and $0.0277, with support holding steady near $0.0181.
Shorter timeframes reinforce the bearish picture. On the 4-hour chart, POND remains in a continued consolidation phase between $0.0181 and $0.0219. Indicators such as the MACD signal declining momentum, and the Stochastic RSI points to oversold conditions. This suggests a short-ter…
The post Marlin (POND) Price Analysis: Key Levels to Watch on January 24, 2025 appeared first on Coin Edition.
