

Next Big XRP Move Coming, Bollinger Bands Reveal
 BULLISH
 XRP
XRP
 GMIX
GMIX
 WOULD
WOULD
XRP’s recent price behavior suggests that the asset is entering a critical phase, with technical indicators pointing toward an imminent shift. However, the direction of the move remains unclear.
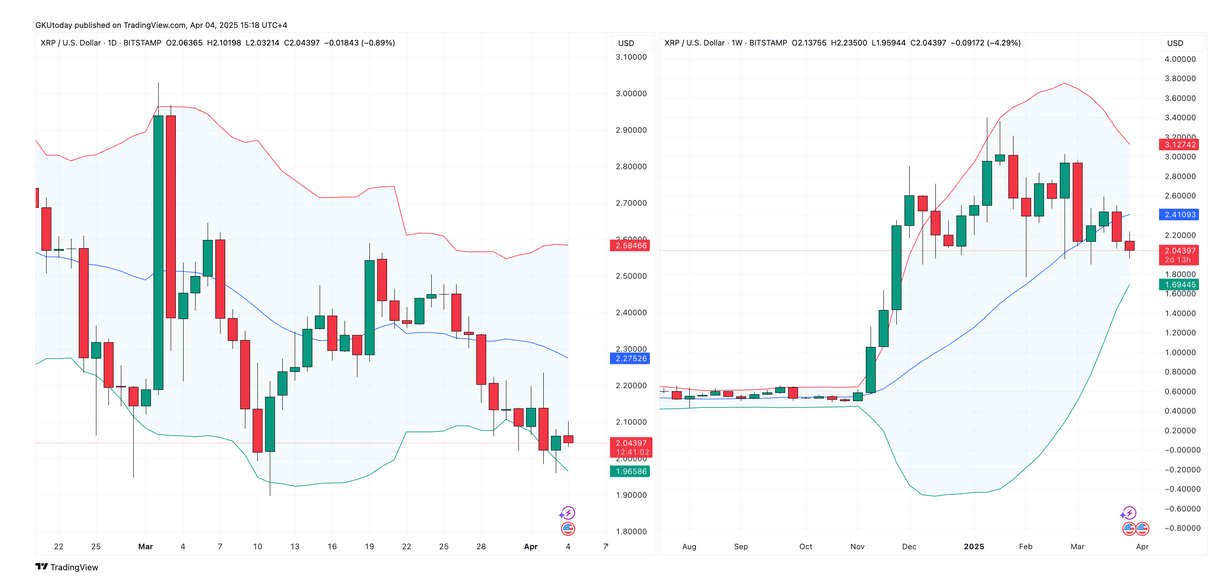
The Bollinger Bands, a widely used tool for analyzing volatility, provide conflicting signals on different timeframes, leading to two plausible price paths in the near term.
Conflicting Signals Between Timeframes
On the weekly chart, the lower Bollinger Band is positioned near $1.696. This level acts as a potential support point if downward pressure persists. A move toward this area would indicate a broader weakening trend in the market, possibly signaling a slow retreat in price rather than a sharp decline.
The implication is that XRP could enter a phase where selling interest grows gradually, causing buyers to hesitate and short-term holders to exit their positions.

We are on twitter, follow us to connect with us :- @TimesTabloid1
— TimesTabloid (@TimesTabloid1) July 15, 2023
In contrast, the daily chart presents a more stable outlook. The middle Bollinger Band is approximately $2.275, representing a possible target if buyers regain control.
Should XRP move toward this mid-range level, it would suggest that the current consolidation phase was a temporary pause in upward momentum rather than the beginning of a broader decline. This would not necessarily signal a strong bullish breakout but rather a return to a more neutral, balanced range after the recent underperformance.
Bollinger Band Squeeze Indicates Imminent Price Move
One key feature across both charts is the narrowing of the Bollinger Bands. This pattern, often called a squeeze, typically signals a period of low volatility before a significant price movement. Although the squeeze does not predict direction, it highlights that the current sideways price action is unlikely to last much longer.
In early 2025, a prominent analyst pointed to the Bollinger Bands to predict a price surge, and XRP rose to a multi-year high of $3.39. Given the conflicting signals from the daily and weekly timeframes, the next move will likely depend on which timeframe gains control.
If the market leans toward the weekly outlook, then a gradual drift down toward $1.696 becomes more probable, and given recent bearish signals, the asset could fall further. However, if the daily structure dominates, XRP could push back to the $2.275 zone, signaling renewed buying strength.
Until the chart provides a clearer signal, it is important not to anticipate a breakout direction prematurely.
Disclaimer: This content is meant to inform and should not be considered financial advice. The views expressed in this article may include the author’s personal opinions and do not represent Times Tabloid’s opinion. Readers are urged to do in-depth research before making any investment decisions. Any action taken by the reader is strictly at their own risk. Times Tabloid is not responsible for any financial losses.
Follow us on X, Facebook, Telegram, and Google News
The post Next Big XRP Move Coming, Bollinger Bands Reveal appeared first on Times Tabloid.

