Octra price prediction talk is spreading fast today, and there's a reason traders can't stop refreshing their charts. OCT just did something it hasn't managed in weeks, and the timing could n
Octra price prediction talk is spreading fast today, and there's a reason traders can't stop refreshing their charts. OCT just did something it hasn't managed in weeks, and the timing could not be more interesting.
Why Every Trader Suddenly Cares About Octra Today
Octra price prediction is trending for one simple reason: the coin pulled off a move nobody expected this week. Prices don't jump 35% in a day without people noticing.
That kind of jump grabs attention fast, and once whales start moving, retail traders tend to follow right behind them, the same pattern showing up acrossaltcoin market trends all week.
Is this the start of a real trend, or just another short-lived spike before sellers come back? Let's break down what's happening, especially with memories of the recent crypto market crash still fresh for traders.
Coin Overview Table Every OCT Holder Should Bookmark
FieldDataCoin NameOctraTicker SymbolOCTBlockchainEthereum-based, traded via UniswapToday High$0.02664Today Low$0.01774RSI Level54.72Token TypeUtility and Privacy Compute TokenToken CategoryPrivacy and Confidential ComputingMarket Cap$15.3M24H Trading Volume$133.96K24H Trading Volume Change-3.03%Circulating Supply625.2M OCT24H Change+35.16%
Source: Data by CoinMarketCap
What Exactly Is Octra And Why It Launched
Octra positions itself as a privacy-first network built around confidential computing, running on fully homomorphic encryption tech the team calls fheOS.
People care because it lets code run on encrypted data without exposing it. That's a rare pitch in a market full of copycats.
How OCT Has Moved Since Its Early Days
OCT touched an all-time high of $0.1417 on June 1, 2026, then dropped over 82% from that peak. It also carved an all-time low of $0.01435 on April 28, 2026.
Since then, the low price has climbed back over 70%. Basically, this token has been on a wild ride lately.
Octra Just Offered A Wild Bounty And Explained What Circles Are
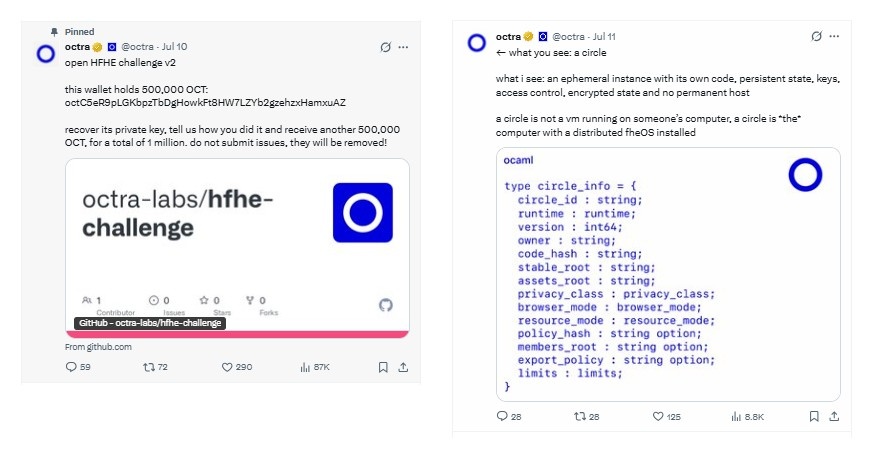
On July 10, the official Octra account posted something that got crypto Twitter talking. They put up a wallet holding 500,000 OCT and challenged anyone to recover its private key.
Crack it and you get another 500,000 OCT, a full 1 million total. It's a cheeky way to prove their encryption holds up under pressure.
A day later, the team explained a core piece of their architecture called a "circle," an ephemeral compute instance with its own code, state, keys, and encrypted storage and no permanent host attached.
Basically, a circle is not a virtual machine sitting on someone's server. It's closer to a distributed unit running on their fheOS layer, with access control baked in.
Source: Posted on X by octra
Fundamental Setup Behind The Current OCT Rally
Buy pressure has clearly outweighed sell pressure over the past day. Data shows 161 buy transactions against 93 sells, with buy volume near $90K against roughly $43K in sells.
But holder concentration is worth watching. The top wallet alone controls over 20% of the supply, and the top ten holders combined hold close to half the tokens, a risk pattern worth comparing against the Ethereum ecosystem, where distribution is far wider.
Octra Technical Price Analysis Traders Are Watching Closely
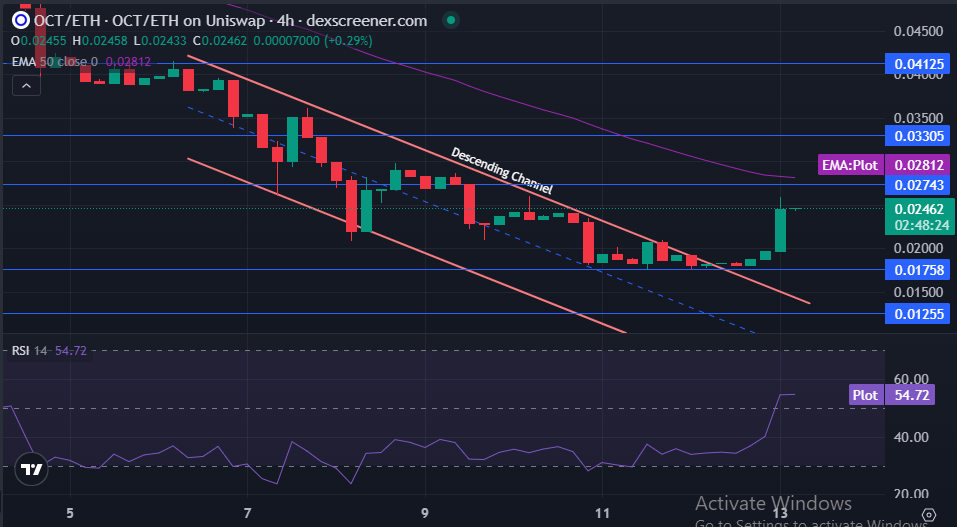
Octra broke out of a descending channel on the 4-hour chart, and that's the real story behind today's move. Price now trades below its 50 EMA near $0.02812, a meaningful shift in short-term structure.
Source: Charting by Dexscreener
RSI sits at 54.72, neutral territory but leaning toward strength. Volume picked up sharply on the breakout candle.
Immediate resistance sits at $0.02743, then a bigger wall near $0.03305.
Support sits at $0.01758, with a deeper invalidation zone at $0.01255.
A close below that invalidation level would flip the entire structure bearish again.
Short-Term OCT Price Prediction For The Coming Days
Short-term momentum favors a continuation test toward resistance, but a pullback to reclaim support first is entirely possible.
TimeframeBearish TargetBase TargetBullish TargetKey Trigger24 Hours$0.02100$0.02460$0.02743Volume holding above average3–7 Days$0.01900$0.02600$0.03000Clean close above resistance2–4 Weeks$0.01758$0.02900$0.03305Sustained buyer dominance
Watch how price behaves around $0.02743 over the next few sessions.
Long-Term OCT Price Prediction Through 2027
The long-term picture depends heavily on whether the fheOS product keeps shipping and whether liquidity grows beyond its current size, much like howBitcoin and Ethereum price movements tend to set the liquidity backdrop for smaller tokens too.
TimeframeBearish TargetBase TargetBullish TargetCatalyst Needed3 Months$0.01500$0.03200$0.04125New exchange listings6 Months$0.01300$0.03800$0.05500Mainnet adoption growthEnd of Year$0.01200$0.04500$0.07000Real developer activity on fheOS2027 Outlook$0.01000$0.06000$0.09500Broader privacy narrative demand
The long-term case leans speculative for now, and it needs consistent product news to stay credible.
Three Realistic Price Scenarios For Octra Right Now
Worst Case: Sellers reclaim control below $0.01758, and the breakout gets rejected as a fakeout. Broader market weakness would accelerate this outcome.
Base Case: Price consolidates between $0.02000 and $0.02800 while the market digests the recent jump.
Best Case: A confirmed close above $0.03305 with strong volume pulls in fresh momentum buyers. That would need a wider altcoin rally as the catalyst.
ScenarioPrice RangeWhat Triggers ItWorst Case$0.01200 - $0.01758Breakdown below the invalidation zone.Base Case$0.02000 - $0.02800Sideways digestion following the recent rally.Best Case$0.03305 - $0.04500Volume-backed breakout continuation.Key OCT Price Levels Every Trader Should Watch
Resistance zone: $0.02743 and then $0.03305 above, both capping recent rally attempts.
Support zone: $0.01758, the level that has held through recent pullbacks.
Invalidation zone: $0.01255; a close below here breaks the current bullish case entirely.
Analyst View And Final Thoughts On OCT Right Now
When we pulled up the RSI, the first thing that stood out was how much room OCT has before overbought territory. That leaves space for more upside without an immediate warning sign.
The chart setup looks constructive after the channel breakout, and holding below the 50 EMA supports that read. But a weekly close below $0.02460 would put that structure in doubt fast.
One factor to track beyond the chart: the crypto fear and greed index, since broader sentiment often decides whether small caps like OCT keep their momentum or fade quietly.
The most important level to watch stays $0.01758. Hold that, and the bullish case survives.
Lose it, and this rally becomes just another failed breakout story. Watch the volume.
Disclaimer: This article is for educational purposes only and does not constitute financial advice. Crypto markets are volatile. Consult your investment advisor before making any investment decision.