


Ontology price prediction 2025-2031: Is ONT rising?
 CONV
CONV
 VALU
VALU
 ONT
ONT
 CVG
CVG
 DAILY
DAILY
Key takeaways
- Ontology might reach as high as $0.2791 by 2025.
- Estimates for ONT’s average price in 2028 range from $1.18 to $1.44.
- Ontology’s average price in 2031 will be $3.51, with a maximum price of $4.35.
Ontology (ONT) is a blockchain project that focuses on decentralized identity and data management. It aims to bring trust and security to data exchange in the digital economy. As ONT’s technology continues to evolve, its price movement attracts significant attention from investors and market watchers.
This price prediction will explore ONT’s potential future performance, considering various market factors, technological developments, and broader crypto market trends that could influence its value. Understanding these dynamics is crucial for making informed investment decisions in ONT.
Overview
| Cryptocurrency | Ontology |
| Abbreviation | ONT |
| Current Price | $0.2623 |
| Market Cap | $239.5M |
| Trading Volume | $21.2M |
| Circulating Supply | 912.69M ONT |
| All-time High | $11.18 (May 02, 2018) |
| All-time Low | $0.1301 (Aug 04, 2024) |
| 24-hour High | $0.2627 |
| 24-hour Low | $0.2516 |
Ontology price prediction: Technical analysis
| Metric | Value |
| Volatility (30-day Variation) | 4.98% |
| 50-Day SMA | $ 0.26833 |
| 200-Day SMA | 66.40 |
| Sentiment | Bullish |
| Fear & Greed | 75 (Greed) |
| Green Days | 16/30 (53%) |
Ontology price analysis: ONT faces sharp decline amid strong selling pressure
TL;DR Breakdown
- Ontology price analysis shows a strong bearish trend today
- Ontology’s price has been fluctuating within a tight range of approximately $0.2275 to $0.2564.
The price analysis for Ontology (ONT) for January 19 shows a significant downward trend over the day, with the price decreasing from approximately $0.2511 to $0.231 by the end of the day. The ONT illustrates minor fluctuations with brief upward movements, but the overall trajectory remains bearish.
The steep decline observed in the latter part of the day indicates strong selling pressure, likely driven by market sentiment or external factors affecting the cryptocurrency. This sharp decline positions Ontology near its intraday low, highlighting a challenging trading session.
Ontology 1-day price chart: ONT faces bearish pressure as indicators signal further downside risk
The 1-day chart for Ontology (ONT) indicates a bearish trend, with the price dropping to $0.2286, down by 7.15% for the day. The candlestick pattern reveals significant selling pressure, with lower highs and lower lows reflecting a continuous decline. Volume levels remain moderate, signalling limited buyer activity despite the price drop. The price’s proximity to recent support levels suggests heightened vulnerability if selling momentum continues.
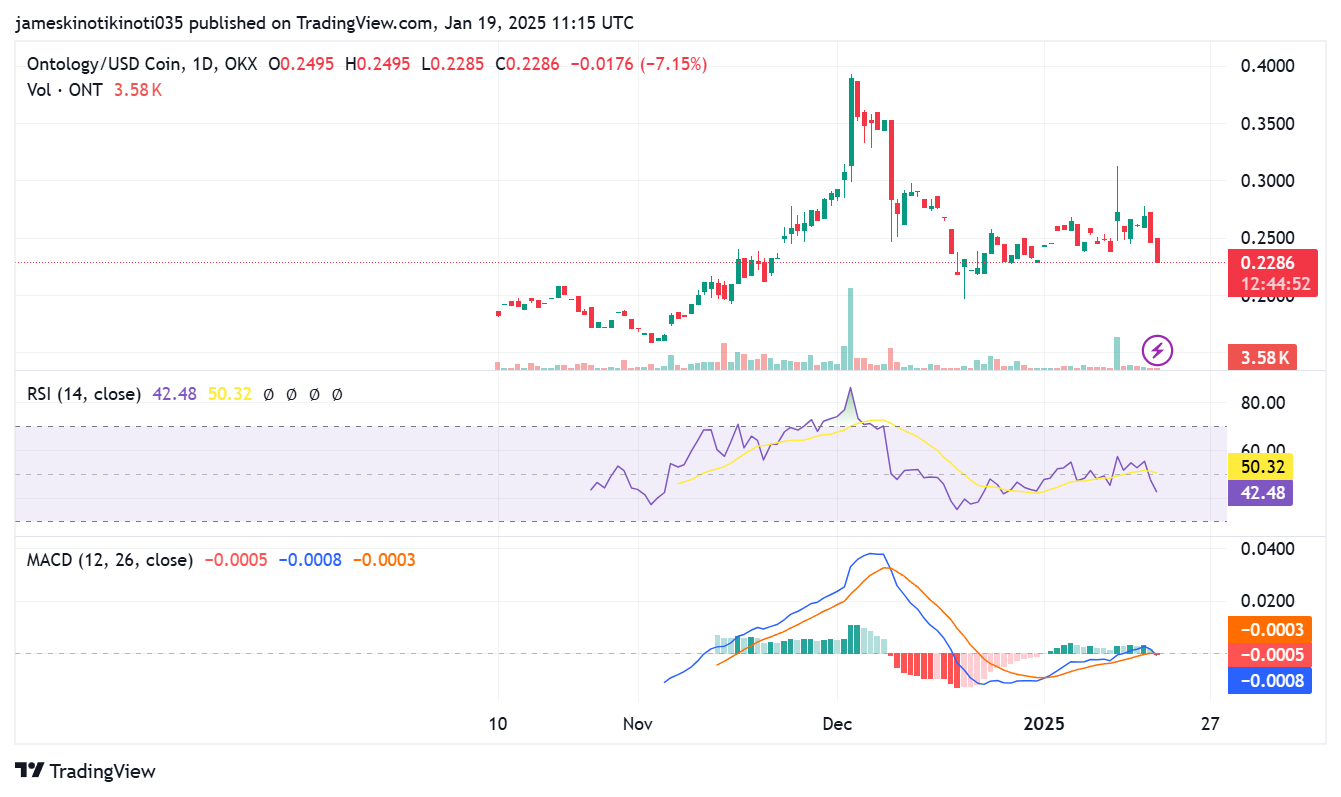
The Relative Strength Index (RSI) stands at 42.48, indicating that ONT is approaching oversold territory but not yet heavily undervalued. This suggests weakened buying pressure. The Moving Average Convergence Divergence (MACD) indicator shows a bearish crossover, with the MACD line dipping below the signal line. The histogram bars are negative and close to the baseline, further confirming bearish sentiment and a lack of upward momentum.
Ontology 4-hour chart: ONT faces bearish pressure
The Ontology (ONT) 4-hour chart demonstrates a bearish trend as the price has declined by 4.95% to trade at $0.2286. The price has consistently failed to maintain support above $0.2300, breaking below key levels as selling pressure increases. The descending candlestick pattern reflects a lack of bullish momentum, with lower highs and lower lows dominating the short-term price action. The low trading volume of 994 ONT also signals diminished market activity, contributing to the bearish sentiment.
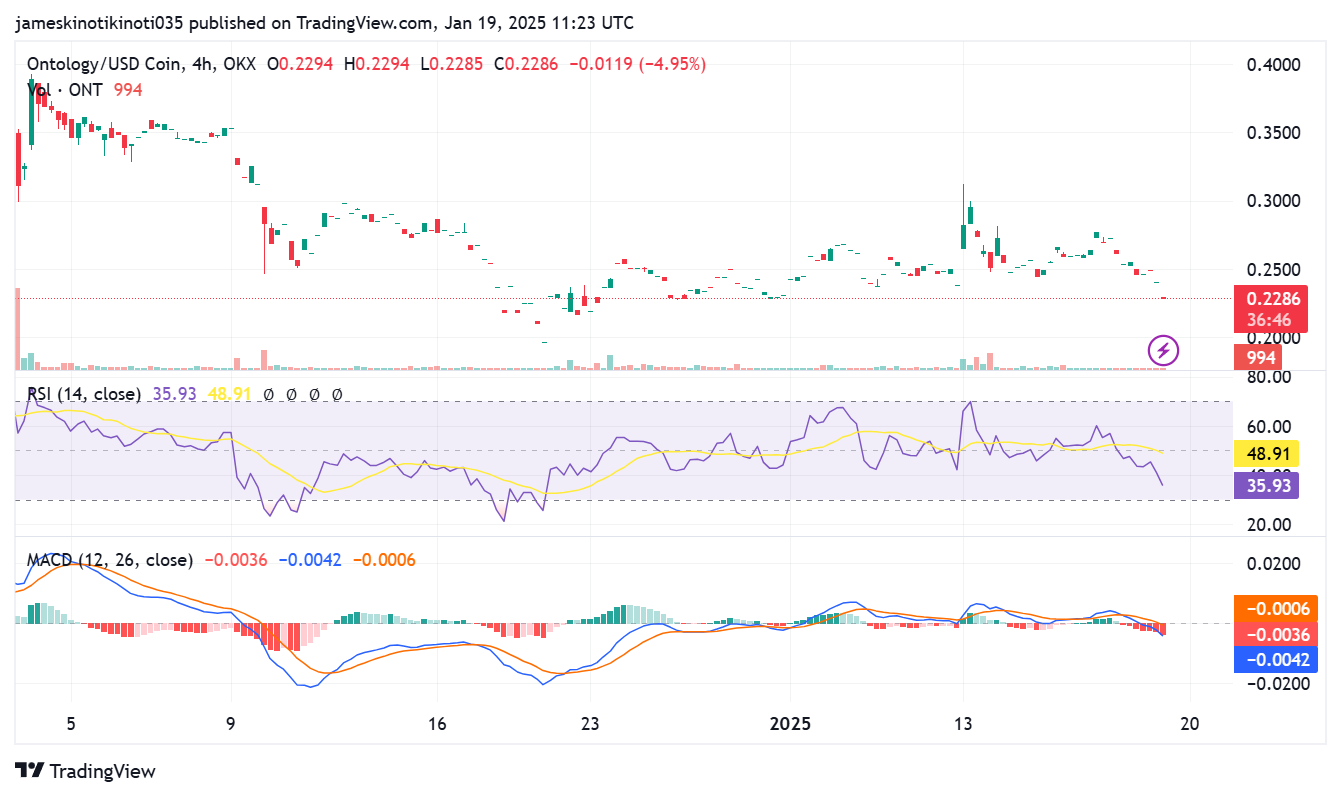
The Relative Strength Index (RSI) on the 4-hour chart is at 35.93, which suggests ONT is approaching oversold territory. This indicates potential for a short-term rebound but also highlights the lack of buyer interest. The Moving Average Convergence Divergence (MACD) indicator shows a bearish crossover, with the MACD line falling below the signal line at This bearish divergence reinforces the downward momentum, hinting that the bearish trend may persist unless there is significant buying support.
Ontology technical indicators: Levels and action
Daily simple moving average
| Period | Value ($) | Action |
| SMA 3 | 0.250448 | BUY |
| SMA 5 | 0.255648 | BUY |
| SMA 10 | 0.253649 | BUY |
| SMA 21 | 0.248294 | BUY |
| SMA 50 | 0.26833 | SELL |
| SMA 100 | 0.232275 | BUY |
| SMA 200 | 0.207281 | BUY |
Daily exponential moving average
| Period | Value ($) | Action |
| EMA 3 | 0.261162 | BUY |
| EMA 5 | 0.257576 | BUY |
| EMA 10 | 0.253785 | BUY |
| EMA 21 | 0.252383 | BUY |
| EMA 50 | 0.250633 | BUY |
| EMA 100 | 0.238906 | BUY |
| EMA 200 | 0.231898 | BUY |
Ontology price analysis conclusion
The analysis of Ontology’s price across both the 1-day and 4-hour charts indicates a prevailing bearish trend, with the price struggling to hold key support levels and showing signs of weak market momentum. Both timeframes highlight declining buying interest, with technical indicators such as RSI and MACD pointing toward further downward pressure. This overall trend suggests that the market is leaning toward bearish sentiment, and a clear reversal would require stronger volume and renewed buyer confidence to stabilize the price.
Is Ontology a good investment?
Ontology (ONT) could be a good investment for those who believe in its focus on decentralized identity (DID) and data privacy solutions, as it offers strong utility for businesses and individuals. The project has potential due to its real-world applications, partnerships, and efforts toward ecosystem growth. However, ONT, like other cryptocurrencies, is highly volatile and influenced by market sentiment, adoption, and regulatory risks. While it may show promise, it’s essential to assess its price trends, competition, and your own risk tolerance before investing. Always diversify your portfolio and conduct thorough research beforehand.
Will ONT reach $1?
Yes, Ontology is expected to reach $1. Projections for 2027 suggest ONT could reach up to $1.02.
Will ONT reach $10?
ONT’s ATH is $11.18; reaching $10 seems achievable, but not soon.
Will ONT reach $100?
Reaching $100 for Ontology would be an extremely ambitious and unlikely target under current market conditions and technological adoption rates.
Does ONT have a good long-term future?
Ontology (ONT) faces significant challenges in achieving substantial long-term growth, especially given the ambitious targets for prices like $10. While there is potential for moderate growth if the project gains adoption and market conditions improve, the steep increase required to reach such high targets suggests that ONT’s long-term future may be uncertain and highly dependent on significant developments and broader market trends.
Ontology price prediction January 2025
Ontology price prediction for January 2025 suggests that the token will reach a minimum value of $0.2481, a maximum price value of $0.2791, and an average trading value of $0.2713.
| Month | Potential Low | Average Price | Potential High |
| January 2025 | $0.2481 | $0.2713 | $0.2791 |
Ontology price prediction 2025
The price of Ontology is predicted to reach a minimum value of $0.3876, a maximum value of $0.4415 and an average trading price of $0.3979 by the end of 2025.
| Month | Potential Low ($) | Average Price ($) | Potential High ($) |
| 2025 | 0.3876 | $0.3979 | 0.4415 |
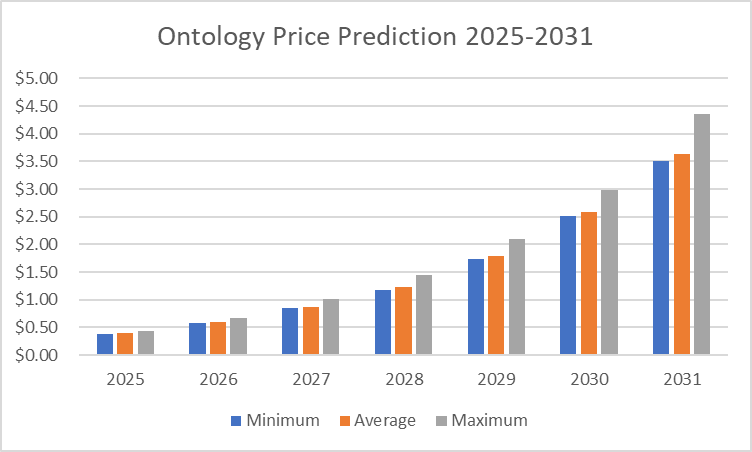
Ontology price predictions for 2026-2031
| Year | Minimum price | Average price | Maximum price |
| 2026 | $0.5754 | $0.5953 | $0.6776 |
| 2027 | $0.8411 | $0.8649 | $1.02 |
| 2028 | $1.18 | $1.22 | $1.44 |
| 2029 | $1.73 | $1.79 | $2.09 |
| 2030 | $2.51 | $2.58 | $2.99 |
| 2031 | $3.51 | $3.64 | $4.35 |
Ontology price prediction 2026
Per the ONT price prediction for 2026, the cryptocurrency could potentially reach a high of $0.6776 and a minimum price of $0.5754. The expected average trading price of $ONT for the year is $0.5953.
Ontology price prediction 2027
Estimates suggest that Ontology will achieve a high price of $1.02 in 2027. The minimum price for this period is $0.8411. Additionally, the estimated average trading price is $0.8649.
Ontology ONT price prediction 2028
The Ontology forecast for 2028 suggests a minimum price of $1.18. According to expert analysis, ONT’s price could reach a maximum of $1.44 and an average forecast price of $1.22.
Ontology price prediction 2029
By 2029, Ontology could reach a maximum price of $2.09, a minimum trading price of $1.73, and an average price of $1.79.
Ontology price prediction 2030
According to the Ontology price forecast for 2030, ONT could reach a maximum price of $2.99. The token’s minimum price is projected to be $2.51, with an average trading price of $2.58.
Ontology price prediction 2031
In 2031, the price of Ontology is predicted to reach a minimum of $3.51, a maximum of $4.35, and an average trading price of $3.64.
Ontology market price prediction: Analysts’ ONT price forecast
| Firm Name | 2025 | 2026 |
| DigitalCoinPrice | $0.57 | $0.68 |
| Wallet Investor | $0.35 | $0.41 |
| Coincodex | $0.2376 | $0.2522 |
Cryptopolitan’s Ontology price prediction
Our predictions show that ONT will trade between $0.3876 and $0.4415 by the end of 2025. In 2027, Ontology’s market price will range between $0.8411 and $1.02. In 2031, ONT will range between $3.51 and $4.35, with an average price of $3.64.
Ontology historic price sentiment
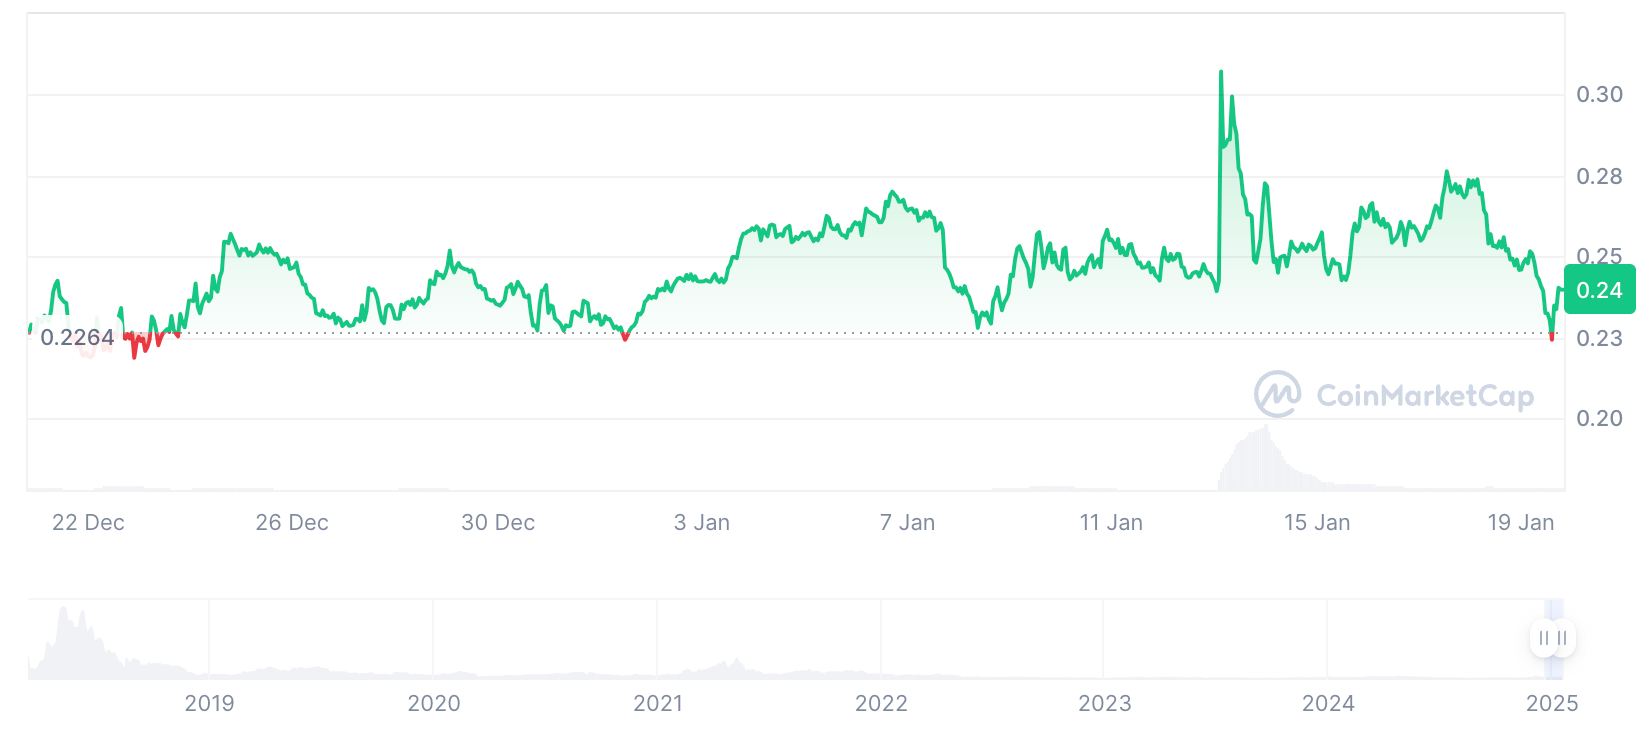
- Ontology launched in 2017 via airdrops, peaking at $11.18 in May 2018 before a sharp decline. By 2019, it settled between $1.21 and $1.84 after initial highs.
- The price ranged from $0.204 to $2.96, spiking during the 2021 bull run before dropping again.
- Since 2022, the price has stayed low, hovering near $0.26 by late 2024.
- In January 2025, Ontology opened trading at $0.2293 and currently trades between $0.2239 and $0.2524.
