


Pi Coin Price Prediction for Today (May 2)
 KAS
KAS
 X
X
 X
X
 PI
PI
 CIN
CIN
The Pi Coin price dipped 2.5% in the last 24 hours and is now trading slightly below $0.60 level. On the weekly timeframe, the coin lost around 8.5% in valuee.
Yesterday, we predicted that a drop below $0.57 or break above $0.63 could determine coin’s next direction, but neither happened. Let’s see where is the Pi Coin price headed today.
Where the Pi Coin Price Stands Now
Pi Coin is trading just below $0.60. The price tried to move higher on April 30 but failed to hold the breakout. Since then, it has been moving sideways and staying under resistance. There is no clear direction right now.
The 4-hour chart shows a short-term downtrend. The price has been making lower highs and lower lows since mid-April. This pattern usually means sellers are still in control. If buyers do not step in soon, the price could continue to fall.
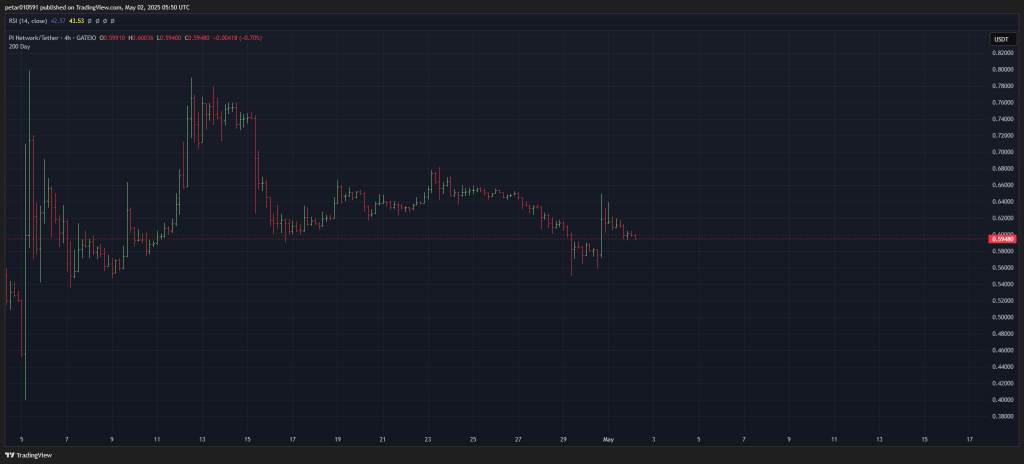
There is strong resistance between $0.60 and $0.62. This zone has already rejected the price several times. If Pi drops below $0.57, the next support is around $0.52. That level acted as a bounce point before.
Recent candlesticks have long wicks on both sides. This shows uncertainty in the market. Neither buyers nor sellers have a clear advantage right now.
Read also: Kaspa Price at 15% of XRP’s Market Cap Might Surprise You
Key Technical Signals
Most indicators point to weakness. The MACD is at -0.054, which shows bearish momentum. The CCI is at -123, which means the asset is in oversold territory. That could suggest a bounce, but it still matches the overall weakness.
The Ultimate Oscillator is at 41.8, which is below the neutral level of 50. This shows there is little strength from buyers. The ROC is at -6.74, which confirms downward momentum. The Bull/Bear Power is at -0.0425, which shows that bears still have the edge.
| Indicator | Value | Interpretation |
|---|---|---|
| RSI (14) | 43.53 | Weak momentum, near oversold territory (<50 is bearish) |
| MACD | -0.054 | Bearish crossover active, negative momentum |
| CCI | -123.52 | Oversold signal (below -100 is considered oversold) |
| Ultimate Oscillator | 41.83 | Below 50, indicating bearish momentum |
| ROC (Rate of Change) | -6.744 | Strong downward momentum |
| Bull/Bear Power | -0.0425 | Bears currently stronger than bulls |
Pi Coin Price Prediction for May 2
If the price falls below $0.57, it may drop further to $0.56 or even $0.52. The indicators support this bearish outcome. Most of them suggest that sellers are still in control.
However, if Pi breaks above $0.60 with strong volume, a short-term rally is possible. In that case, it could move toward $0.63. If that level breaks too, the price might revisit $0.68, which was a consolidation zone in April. For this bullish case to happen, the MACD must turn positive and the RSI must rise above 50.
Right now, Pi Coin is in a tight range. The market is waiting for a clear move before deciding the next direction.
Follow us on X (Twitter), CoinMarketCap and Binance Square for more daily crypto updates.
Read our recent crypto market updates, news, and technical analysis here.

We recommend eToro
Wide range of assets: cryptocurrencies alongside other investment products such as stocks and ETFs.
Copy trading: allows users to copy the trades of leading traders, for free.
User-friendly: eToro’s web-based platform and mobile app are user-friendly and easy to navigate.
The post Pi Coin Price Prediction for Today (May 2) appeared first on CaptainAltcoin.
