So where does the Shiba Inu price forecast talk land right now? Mostly on patience. This is the meme coin that once minted overnight millionaires, and it's spent this year grinding sideways i
So where does the Shiba Inu price forecast talk land right now? Mostly on patience.
This is the meme coin that once minted overnight millionaires, and it's spent this year grinding sideways instead, well off its all-time high while the broader market chews through volatility.
Price sits near $0.0000046 today, with a market cap close to $2.7 billion, still comfortably inside the top 40 cryptocurrencies by size.
Anyone who bought during the 2021 mania already knows this rhythm: long stretches of not much, then a sudden move nobody quite saw coming.
That's basically where things stand. A coiled setup, not a coin trending hard in either direction.
$SHIB Live Market Data
Shiba Inu currently trades at $0.00000464, down 0.4% on the day. Range over the last 24 hours has been tight, $0.00000457 to $0.00000466. 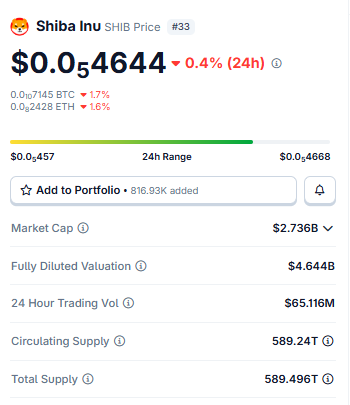
Source: $SHIB market cap data taken from Coingecko, data as of Aug 08, 2026. Figures may vary slightly across other tracking websites.
Market cap holds near $2.736 billion, and fully diluted valuation runs about $4.644 billion.
Volume clocked in at $65.116 million, with circulating supply at 589.24 trillion tokens out of a 589.496 trillion total supply.
Liquidation Data
Longs keeps taking the hit. In the past hour alone, $111.04 got wiped out, all of it from long positions. Stretch that to four hours, and total liquidations reach $1.03K, with $111.04 in longs against $916.39 in shorts. 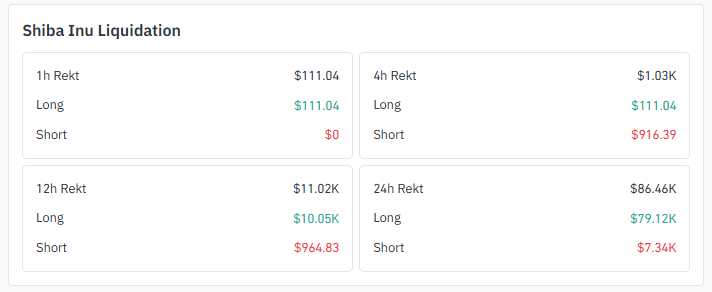
Source: Liquidation Data Taken From Coinglass.
Twelve hours out, $11.02K liquidated, with longs accounting for $10.05K of it.
And over a full day? $86.46K gone, long absorbing $79.12K of that against a mere $7.34K on the short side.
Leveraged dip buyers keep getting caught offside, plain and simple.
Exchange Volume
OKX dominates SHIB futures activity, $14.14M in volume and counting. LBank sits next at $7.36M, MEXC not far behind at $6.76M. 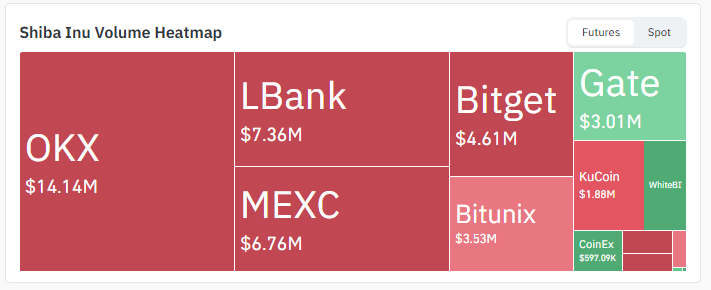
Source: Volume Heatmap Data Taken From Coinglass.
Bitget brought in $4.61M, and Bitunix brought in $3.53M, while Gate, KuCoin, and CoinEx split up whatever's left in smaller pieces.
Key Takeaways
SHIB is sitting around $0.00000464 right now, pinned just under a key daily trendline. That's the heart of this shiba inu price forecast.
Squeezed inside a descending channel on the 4H chart. Which way it breaks decides the next leg.
Volume-backed strength above $0.00000517, and the path opens toward $0.00000670.
Lose the floor, and $0.00000406 comes back into the picture fast.
Longs are still the ones bleeding; $86.46K in liquidations over 24 hours tells that story on its own.
Technical analysis for the Shiba Inu price forecast.
Zooming into the charts behind this Shiba Inu price forecast, here's what both timeframes show.
4-Hour Chart Analysis of $SHIB Forecast:
The $SHIB price is inside a descending channel on the 4H chart. 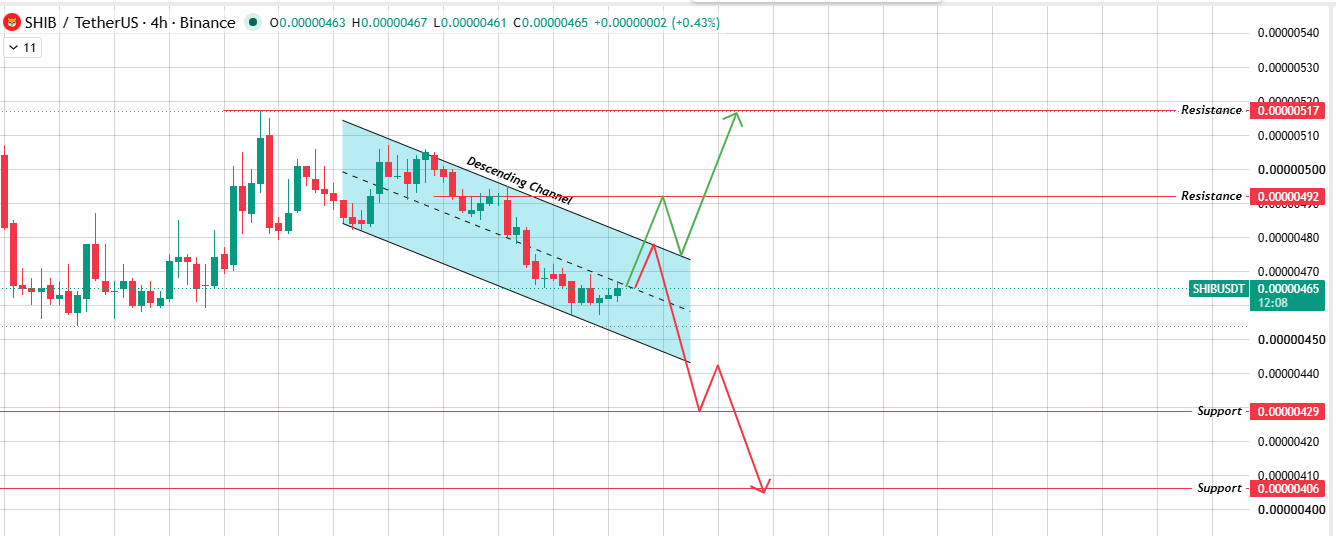
Source: Chart Taken From TradingView.
If it breaks the upper boundary with volume, it moves toward the upper resistance levels, $0.00000492 first, then $0.00000517.
If the price gets rejected from the upper boundary and breaks down the lower boundary instead, it heads toward the lower support levels, $0.00000429 and then $0.00000406.
Daily Chart Analysis of $SHIB Forecast
A trendline running back from the last swing high has capped every bounce so far, including a sharp move off a demand zone sitting between $0.00000455 and $0.00000460. 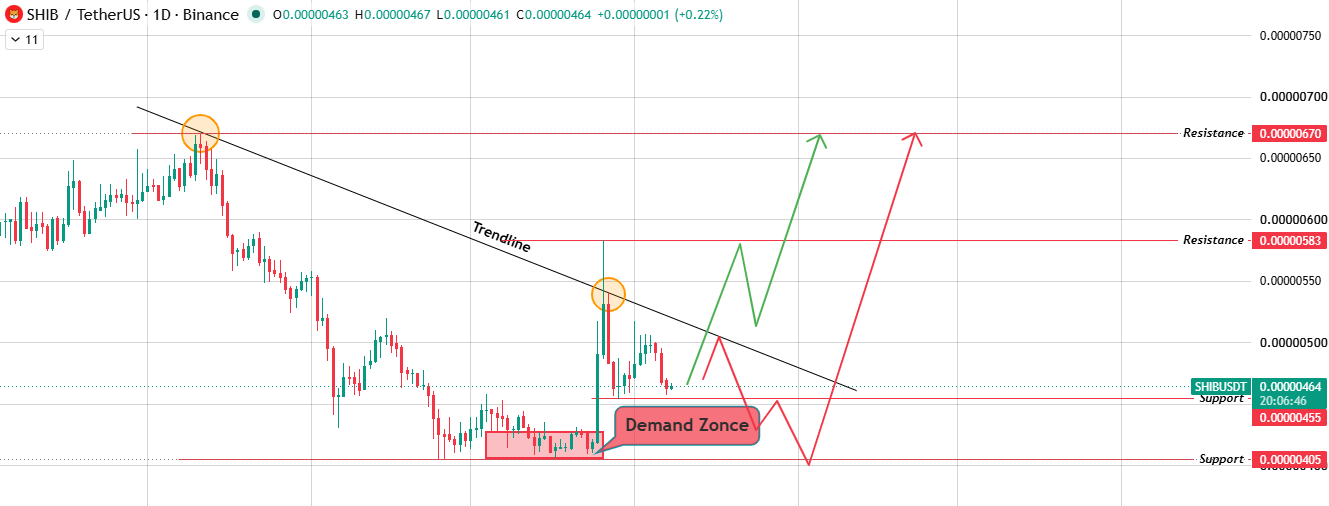
Source: Chart Taken From TradingView.
Clear that trendline with volume and $0.00000583 opens up, followed by $0.00000670.
Get rejected there instead and slide back into the demand zone, and $0.00000405 becomes the level to watch if it fails to hold.
Bull, Base, and Bear Case
Start with the 4H chart. $SHIB is boxed inside a descending channel, and a volume-backed break above the upper boundary sends buyers toward $0.00000492 first, then $0.00000517.
Rejected there instead? A break below the lower boundary follows, and sellers likely drag the price down to $0.00000429, maybe all the way to $0.00000406.
Zoom out to the daily, and it's the same tension from a different angle.
Price is still capped below a longer descending trendline. Clear that with volume and the bias, it flips bullish.
Get rejected and slide back into the demand zone, though, and it's not automatically bad news; a liquidity sweep there could shake out weak hands before the price turns and climbs.
Base case for now? Chop. Between the demand zone and the trendline, until one side actually shows up with volume.
Glossary
Picture two slanted lines running parallel, boxing price into a steady downward drift; that's a descending channel.
Traders watch the edges for a breakout or breakdown. What's a descending trendline? A single sloped line connecting lower highs, acting like a ceiling until price finally closes above it.
Demand zone refers to a price area where buyers have stepped in before, hard enough to reverse a decline, so it earns another look as potential support.
Ever heard of a liquidity sweep? That's a quick wick through an obvious support or resistance level, one that grabs stop losses right before the price reverses the other way.
And liquidation simply means an exchange force-closing a leveraged position once losses have eaten through the trader's margin.
Methodology:Every level in this Shiba Inu price forecast comes straight from 4H and daily chart analysis. Liquidation numbers are sourced from Coinglass, and exchange volume is from live futures heatmaps. Nothing here gets extrapolated beyond what the charts actually show.
Disclaimer: This article is for informational purposes only and does not constitute financial advice. Cryptocurrency markets are highly volatile and speculative. Estimated probabilities reflect technical analysis of chart patterns, not certainty. Always conduct independent research and consult a licensed financial advisor before making investment decisions.