Solana price has held near $121 after its September recovery, with positive daily money flow supporting a renewed test of $125 resistance as traders watch whether October can bring a move tow
Solana price has held near $121 after its September recovery, with positive daily money flow supporting a renewed test of $125 resistance as traders watch whether October can bring a move toward $150.
Summary
- Solana price traded near $120.80, below the weekly chart’s $125 support and resistance pivot.
- Daily Supertrend support stood at $107.22, while Chaikin Money Flow remained positive at 0.23.
- Trading posts on X identified $116–$119 support and potential upside levels between $126 and $132.
- CoinGlass showed prominent liquidation concentrations around $115–$116 below price and $123–$125 above it.
Solana daily chart showed its price at $120.83 on Oct. 6, with a daily high of $122 and a low of $118.88. The token was little changed on the day, following a sharp September rebound and several sessions of trading below its recent peak.
The daily chart shows SOL recovering from the mid-$90s in September to the mid-$120s later that month. Price has since moved sideways around $120 rather than extending the rally, leaving the late-September high as the nearest barrier to another advance.
At $120.83, SOL sat approximately 3.5% below the weekly chart’s $125 pivot. A move to $150 would require a gain of roughly 24%, making the nearer resistance levels central to the October outlook.
You might also like: Solana launches tool to settle bank trades in seconds
Solana’s $125 barrier separates recovery from another advance
The weekly TradingView chart places $125 at the Murrey Math indicator’s major support and resistance pivot. SOL was trading at $120.77 on that timeframe, below a level that also overlaps the recent September peak.
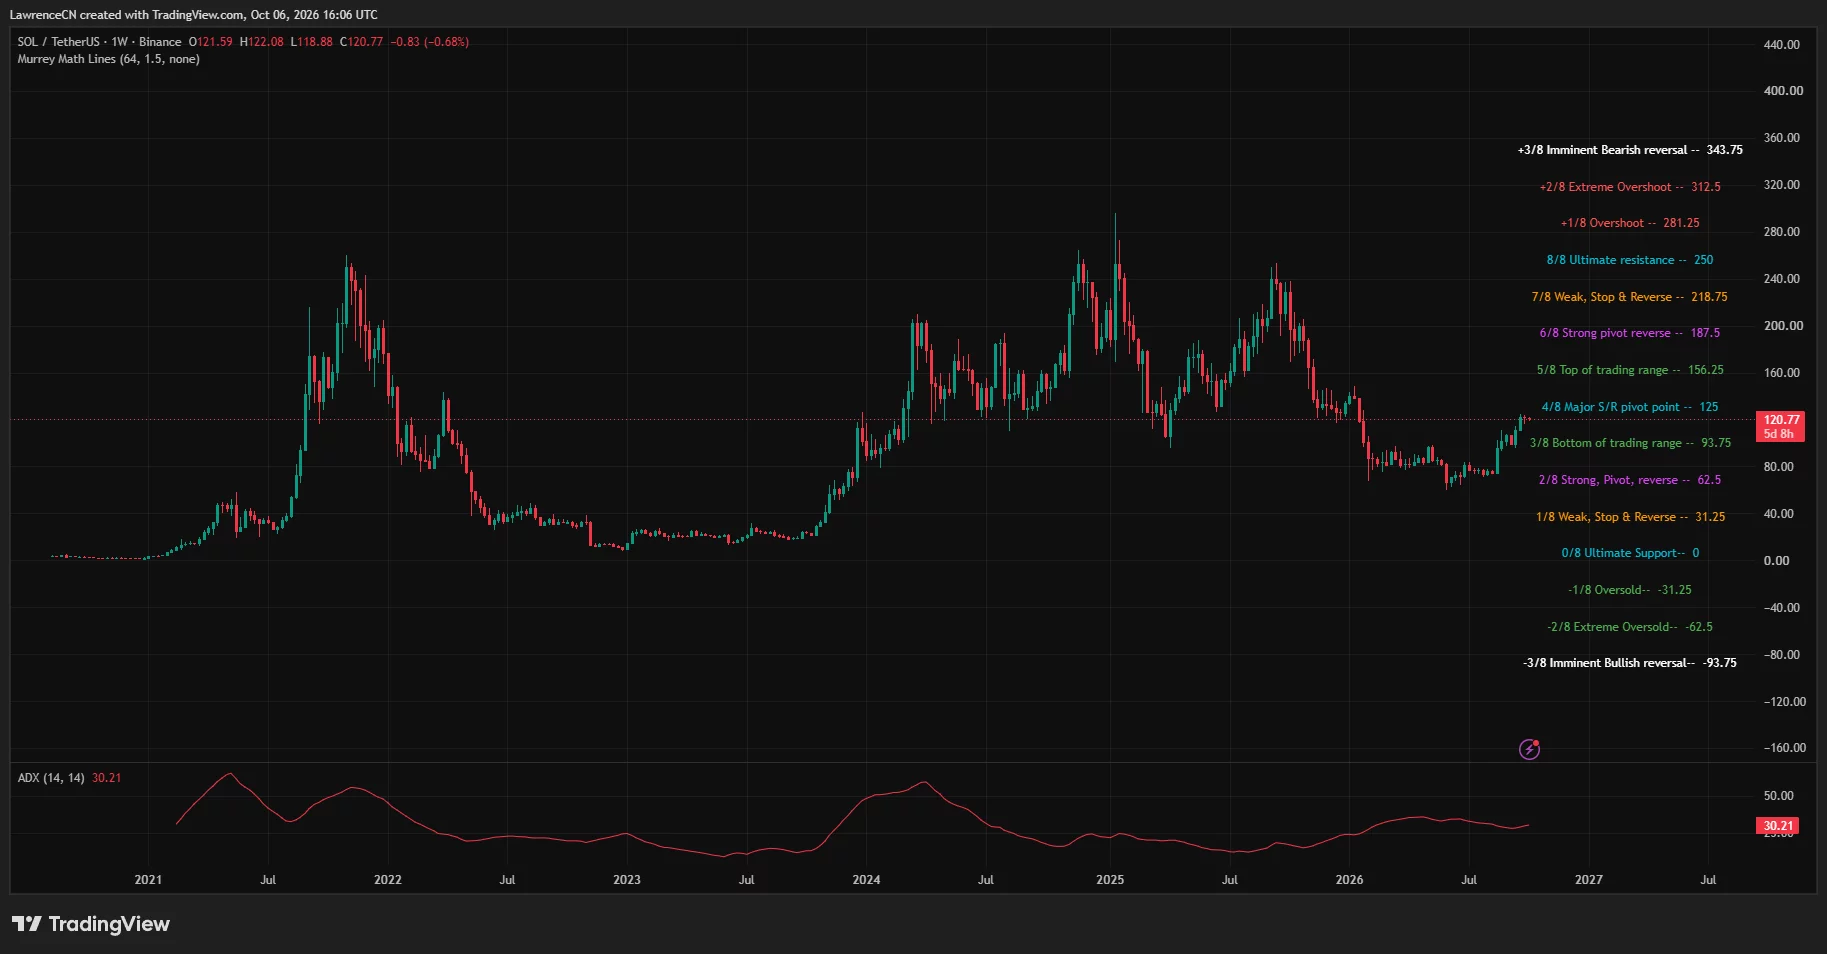
Solana price weekly chart — Oct. 6 | Source: TradingView
The next higher Murrey Math level stands at $156.25, marked as the top of the indicator’s trading range. Below the current price, the corresponding lower boundary sits at $93.75.
The weekly indicator creates a broad trading framework, while the daily chart places the immediate contest much closer to $125. A sustained break above that barrier would move SOL beyond its recent consolidation ceiling; another rejection would keep price inside the existing range.
Weekly Average Directional Index stood at 30.21. ADX measures trend strength rather than direction, so the reading does not independently establish a bullish October forecast.
The weekly price history also shows that the current recovery remains below the much higher trading levels recorded in 2025. October’s nearer upside setup therefore centers on reclaiming $125 before testing the next resistance areas.
Positive daily money flow supports the recovery
On the daily chart, Solana’s Supertrend remained green at $107.22, placing its trend support approximately 11.3% below the $120.83 price reading. SOL has remained above that line during its latest consolidation.
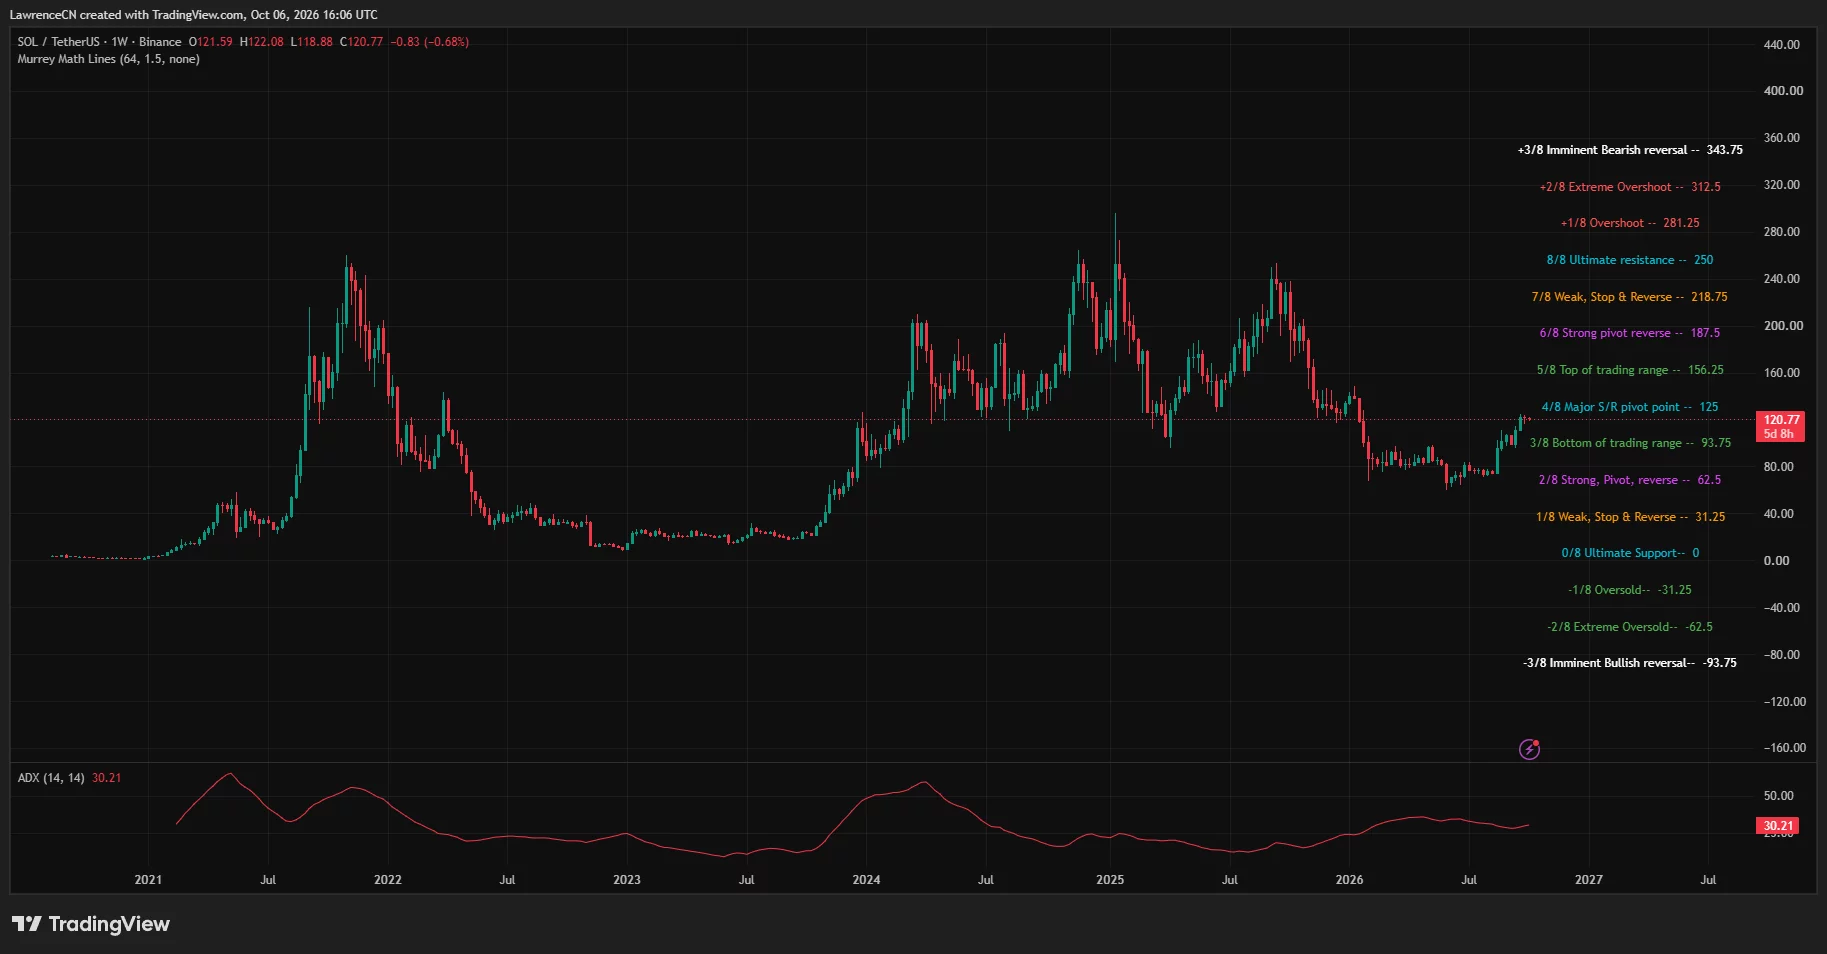
Solana price daily chart — Oct. 6 | Source: TradingView
Chaikin Money Flow stood at 0.23, above its zero line. The indicator combines price location within each session’s range with trading volume, and the positive reading supports a buying-pressure interpretation on the daily timeframe.
Daily CMF has recovered from its September dip below zero. That improvement has accompanied SOL’s move back toward $120, although price has yet to clear the late-month high.
The daily indicators consequently show a positive trend backdrop beneath unresolved resistance. Holding nearby support would preserve the current consolidation, while a move toward $107.22 would bring price back to the daily Supertrend line.
Two Oct. 6 trading posts on X outlined nearer support and upside scenarios. One identified an entry around $119, a stop below the plotted trendline, and a target of $126–$127.
A separate post identified $116–$119 as support, saying buyers had defended the area three times. That post placed the next resistance at $130–$132 and raised $150 as a possible monthly outcome rather than a confirmed target.
Liquidation bands cluster around $115 and $125
CoinGlass’s one-month Solana liquidation heatmap shows substantial estimated liquidation concentrations on both sides of the current trading range.
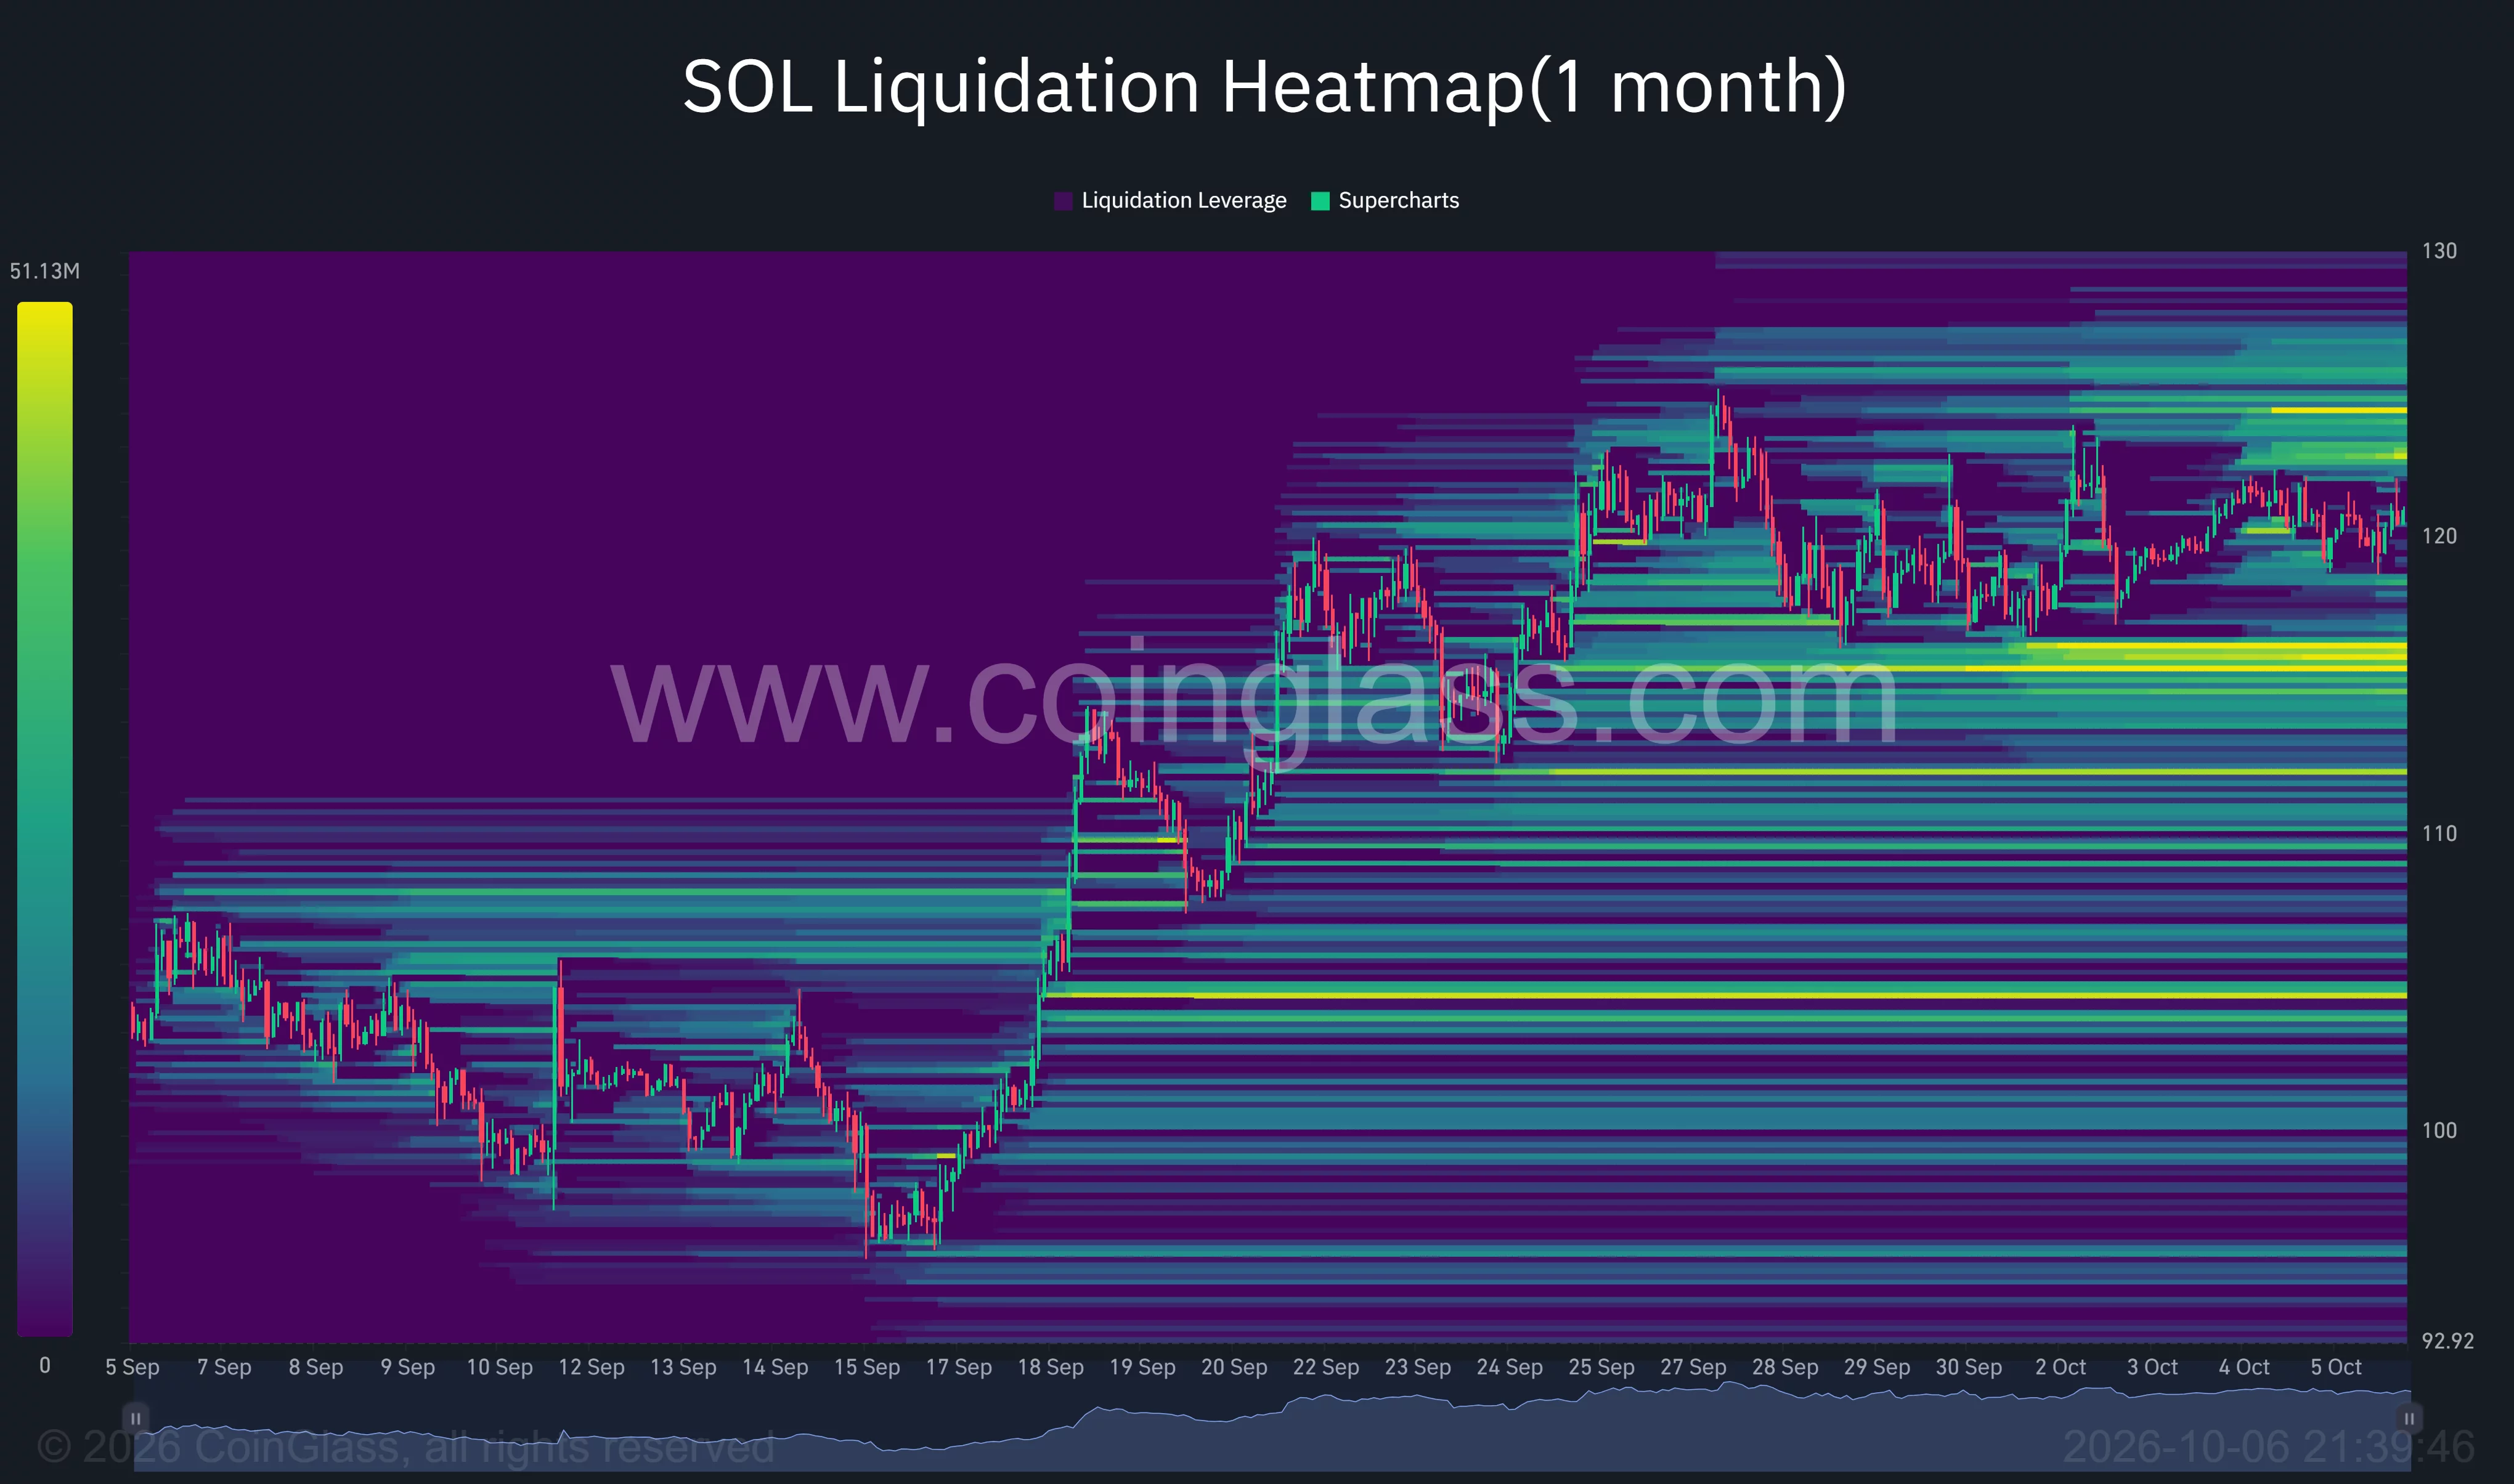
Solana liquidation heatmap | Source:
CoinGlass
Below price, the brightest nearby bands sit around $115–$116. Further concentrations appear near $112 and approximately $104–$105, extending the downside levels beyond the support area identified in the X trading posts.
Above price, visible bands cluster around $123–$125, with additional concentrations toward $126–$127. The nearby overhead bands overlap the weekly $125 pivot and the first trader’s upside target.
The heatmap therefore places leveraged positions close to both the support zone and the recent highs. A fall through $116 or a rise through $125 would bring SOL into areas with heavier estimated liquidation exposure.
The displayed concentrations represent potential liquidation levels, rather than completed liquidations. The map does not establish that a short squeeze has already occurred during the current consolidation.
October’s $150 scenario depends on clearing nearer resistance
For the bullish scenario outlined in the X posts, SOL first needs to retain the $116–$119 support area and move above $125. The next referenced levels are $126–$127, followed by $130–$132.
A further advance toward $150 would then bring price closer to the weekly Murrey Math resistance at $156.25. Failure to hold $116 would weaken that nearer bullish setup, with the heatmap’s $112 band and daily Supertrend at $107.22 below it.
Network changes remain part of Solana’s October backdrop. The Solana Foundation reported that mainnet slot times reached 250 milliseconds on Sep. 18, with a further reduction to 200 milliseconds scheduled for epoch 1052.
For U.S. investors, the monetary backdrop includes the Federal Reserve’s September tightening. The central bank announced a quarter-point increase on Sep. 16, taking its benchmark target range to 3.75%–4%.
SOL’s immediate technical threshold remains $125. Holding $116–$119 and clearing that barrier would preserve the path toward the traders’ $126–$132 levels, while a $150 October outcome requires a further breakout beyond them.
Disclosure: This article does not represent investment advice. The content and materials featured on this page are for educational purposes only.
Read more: Ethereum price eyes $2,800 as analysts await range breakout