Analyst identified $1.20 as a critical SUI breakout level, with $0.95 as a potential entry if prices fall. Ali Charts is watching $1.27, where an hourly close could confirm another bullish br
- Analyst identified $1.20 as a critical SUI breakout level, with $0.95 as a potential entry if prices fall.
- Ali Charts is watching $1.27, where an hourly close could confirm another bullish breakout for SUI.
- SUI faces resistance around 1.21-1.26, while $1.15 and $1.00 remain important support levels.
SUI is approaching key resistance after recovering sharply from its September lows, with analysts Michael van de Poppe and Ali Charts watching for further gains. Van de Poppe identified $1.20 as a critical breakout level, while Ali Charts is monitoring $1.27. However, both analysts outlined different conditions that could shape SUI’s next move.
Van de Poppe Identifies Two SUI Scenarios
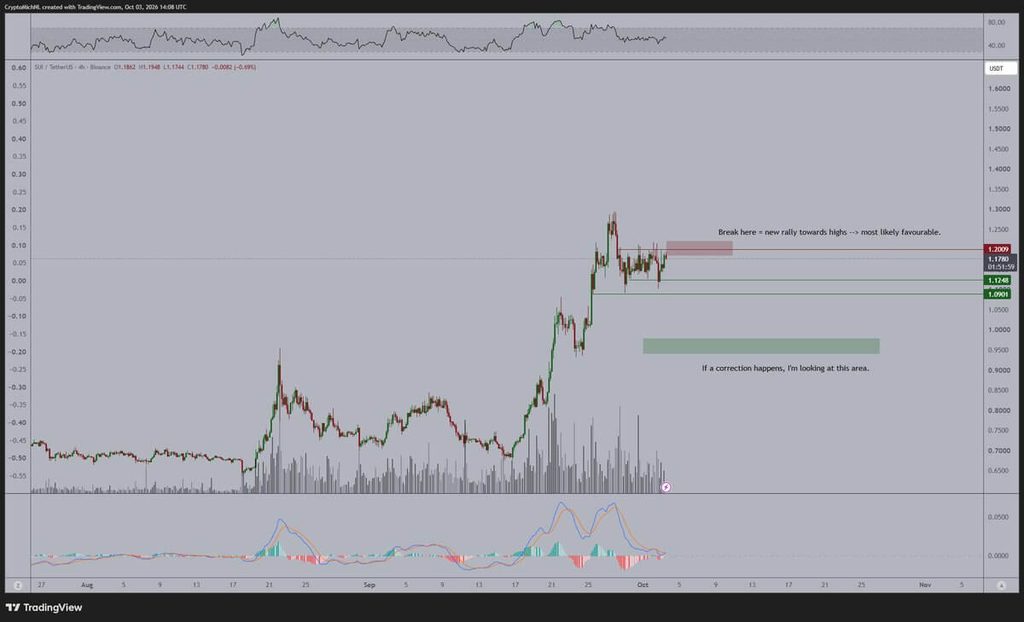
Van de Poppe said SUI could continue rising but highlighted two possible entry scenarios. A break above $1.20 would clear what he considers the final resistance before a further rally. However, Van de Poppe warned that a Bitcoin decline could push SUI lower.
Source: Michael van de Poppe
In that scenario, he identified $0.95 as a potential entry point, describing it as a potentially strong trade opportunity. His analysis places SUI between important price levels, similar to Bitcoin and Ethereum. The analyst did not specify a higher price target following a breakout above $1.20.
Ali Charts Tracks Another Channel Breakout
Meanwhile, Ali Charts identified a repeating pattern of consolidations and upward breakouts that began on September 12. According to the analyst, SUI has completed this sequence three times over recent weeks.
https://twitter.com/alicharts/status/2105878490864091646?s=20
The token is now forming another parallel channel, with $1.27 serving as Ali Charts’ key level. An hourly close above that price could confirm another bullish breakout and potentially begin a further advance.
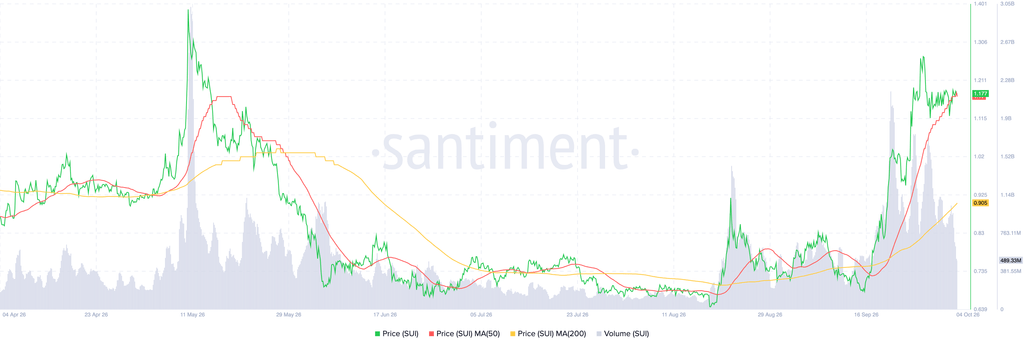
SUI’s chart shows the recovery accelerating from approximately 0.70–0.75 in mid-September. The price subsequently crossed $1.00 and reached around 1.25–1.26 before retreating.
SUI Chart Shows Resistance and Support Levels
SUI recently traded near $1.177, consolidating around 1.15–1.20. The 50-day moving average is near $1.18, while the 200-day average is around $0.905. Immediate resistance lies between $1.21 and $1.26. A decisive move above $1.26 could open a path toward 1.30–1.40.
Source:
Santiment
However, losing the $1.15 support area could expose $1.00, followed by the 200-day average near $0.905. Trading volume expanded during September’s rally, reaching approximately 2.5 billion to 3 billion SUI during peak activity.