Something unusual just happened to a coin most traders had quietly written off months ago. What Just Happened To Vanar Chain That Nobody Saw Coming Vanar Chain price prediction talk is spread
Something unusual just happened to a coin most traders had quietly written off months ago.
What Just Happened To Vanar Chain That Nobody Saw Coming
Vanar Chain price prediction talk is spreading fast across trading groups this morning, and there's a reason for that. The coin barely moved for weeks, then it woke up overnight.
Traders who had this on a watchlist and forgot about it are suddenly checking their screens twice.
The question everyone wants answered: Is this the start of something bigger, or just another short-lived spike that fades by tomorrow?
Vanar Chain price prediction searches are climbing because VANRY jumped over 15% in a single day. That's not a small move for a coin this size.
Basically, the market cap sits around $13 million, so it does not take much buying pressure to move the needle here.
But here's the thing: the broaderaltcoin market has stayed active lately, and that backdrop likely helped VANRY catch a bid today.
We pulled up the chart this morning, and the first thing that stood out was how sharp the reversal looked compared to the last few months.
And that raises a bigger question: is this move backed by something real, or just short-term speculation chasing a green candle?
Vanar Chain Coin Overview and Today's Key Numbers At A GlanceFieldDetailCoin NameVanar ChainTicker SymbolVANRYBlockchainVanar Chain, own Layer 1, EVM compatibleToday High$0.0062585Today Low$0.0049477RSI Level80.51Token TypeNative Gas TokenToken CategoryLayer 1, Gaming and AI InfrastructureMarket Cap$13.28 Million24H Trading Volume$89.21 Million24H Trading Volume Change-9.29%Circulating Supply2.37 Billion VANRY24H Change+15.23%
Source: Data by CoinMarketCap
What Exactly Is $VANRY And Why People Are Watching It
$VANRY is a Layer 1 blockchain built for gaming and entertainment, running its own EVM-compatible network. It was designed to keep fees fixed near half a cent per transaction, no matter how high gas prices get elsewhere.
VANRY is the native gas token that powers the whole chain, and being EVM compatible ties it loosely to the widerEthereum ecosystem of tools and standards.
Why This Coin Matters Now Beyond Just The Price Chart
The chain recently pushed a new AI angle called Neutron, letting any file get converted into something an AI model can query directly.
That's not hype talk either. The project posted this openly, and it landed with real engagement across social platforms.
Vanar has also leaned into a "chain that thinks" narrative, positioning itself away from plain storage and execution toward reasoning-capable infrastructure.
Vanar Chain Liquidation Data Shows Where Traders Got Caught Off Guard
Liquidation totals over the last 24 hours hit $1.72 million, with short positions taking the bigger hit at $1.15 million against $567.07K in long liquidations.
That tells its own story. A lot of traders were betting against VANRY right before this move, and they got squeezed hard.
Source: Liquidation data by CoinGlass
$VANRY Technical Price Analysis Breaks Down Today's Breakout Move
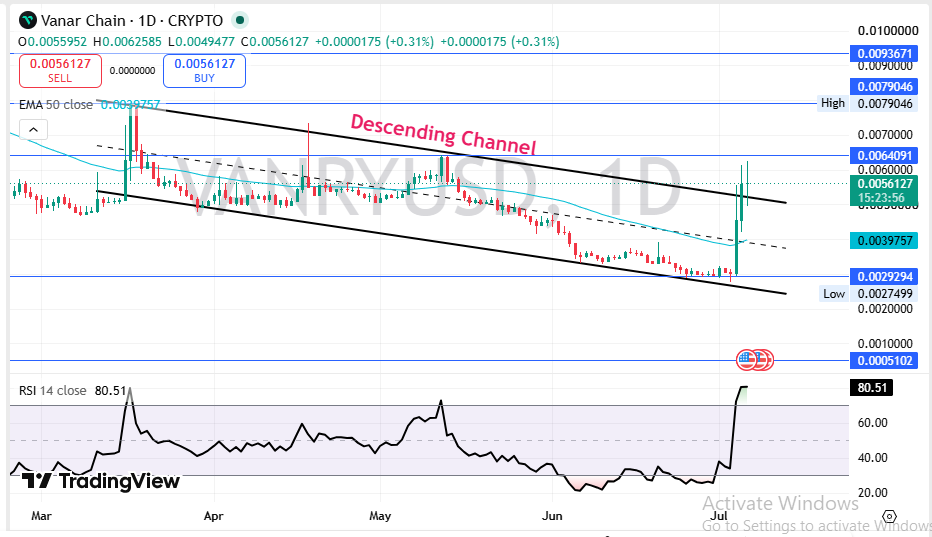
Price broke out of a descending channel that had been pressuring VANRY since March, and that breakout is the real driver behind today's move on the 1-day chart.
Source: Charting by TradingView
Buyers stepped in aggressively once the daily candle cleared the trendline, and volume confirmed the push wasn't just a fakeout.
The 50 EMA sits far below the current price at $0.0039757, and price trading well above it usually signals momentum is firmly with buyers for now.
RSI at 80.51 is deep in overbought territory, though. That's not a bearish signal on its own, but it does raise the odds of a short-term cooldown.
Basically, strong momentum plus stretched RSI often means a pause or pullback before the next leg, not necessarily a reversal.
Vanar Chain Volume Heatmap Reveals Where The Real Buying Came From
Binance dominated trading activity with $430.98M in volume, followed by LBank at $195.33M and Bybit at $77.72M.
That kind of concentration on major exchanges usually points to broader market participation rather than one small exchange pump.
Source: Volume heatmap by CoinGlass
Vanar Chain Short-Term Price Prediction For The Coming Weeks Ahead
The next few days will likely decide whether this breakout holds or fades back into the old range.
TimeframeBearish TargetBase TargetBullish TargetKey Trigger24 Hours$0.0049$0.0058$0.0064Reaction at first resistance near $0.00643–7 Days$0.0044$0.0062$0.0079Volume-backed hold above $0.0064 resistance2–4 Weeks$0.0035$0.0058$0.0095RSI cooling without a real breakdown
Watch how price behaves near $0.0064 over the next few sessions; that level decides the next move.
Vanar Chain Long-Term Price Prediction Heading Into Next Year
Zooming out, the long-term case depends heavily on whether the Neutron AI narrative actually gains developer traction.
TimeframeBearish TargetBase TargetBullish TargetCatalyst Needed3 Months$0.0025$0.0055$0.011Neutron API adoption by real projects6 Months$0.0018$0.0065$0.015New exchange listings and partnershipsEnd of Year$0.0012$0.0075$0.020Broader altcoin season returning2027 Outlook$0.0008$0.0090$0.030Sustained AI plus gaming chain narrative
The long-term case leans speculative right now. It's not weak, but it still needs proof beyond a single announcement.
Three Vanar Chain Price Scenarios Traders Should Prepare For
Worst Case: Buyers fail to defend $0.0049 and momentum fades fast. A broader market pullback would accelerate this outcome.
Base Case: Price consolidates between $0.0049 and $0.0064 for a few weeks. This gives the market time to confirm the breakout is real.
Best Case: Price clears $0.0064 with strong volume and heads toward $0.0079. This needs continued Neutron adoption news to sustain buying.
ScenarioPrice RangeWhat Triggers ItWorst Case$0.0029 to $0.0044Failed support hold and broader market weaknessBase Case$0.0049 to $0.0064Sideways consolidation after the breakoutBest Case$0.0064 to $0.0095Volume-backed breakout with continued AI adoption newsKey Vanar Chain Price Levels Every Trader Should Be Watching
Resistance zone: $0.0064091 and, above that, $0.0079046; both mark previous supply areas where sellers showed up before.
Support zone: $0.0029294 is the first real cushion below the current price if momentum fades.
Invalidation zone: A close below $0.0005102 would break the entire bullish structure and force a full reassessment.
Vanar Chain Analyst View And Final Thoughts On The Current Setup
The chart setup right now favors buyers, and that's just what the data shows.
RSI sitting above 80 means a cooldown is likely before any fresh breakout attempt, though that alone doesn't kill the trend.
A weekly close above $0.0064 would be the clearest signal yet that this move has real legs.
Bitcoin behavior at its own key levels will matter here too, since most altcoins still take cues from BTC first.
One thing worth tracking beyond the chart: whether Neutron actually gets adopted by outside developers, not just promoted internally.
Regulatory moves like the ongoingEU MiCA licensing deadline could also shift sentiment across the broader altcoin market in the coming weeks.
The most important level right now is $0.0064. Everything else follows from how price reacts there.
The chart looks good, but overbought conditions rarely stay ignored for long.
Current market mood can also be checked on theFear and Greed Index, which often moves alongside days like this one.
For now, the setup favors buyers, but a pullback toward $0.0058 or even $0.0049 would not break the bigger picture.
Disclaimer: This article is for educational purposes only and does not constitute financial advice. Crypto markets are volatile. Consult your investment advisor before making any investment decision.