


Why is Ethereum (ETH) Price Down Today? Market Analysis
ETH
 READ
READ
 WOULD
WOULD
Ethereum (ETH) is experiencing a significant downturn, with prices dropping to $1,755, a decline of over 11% within the last 24 hours, according to Coingecko. This drop aligns with broader market turbulence, and a combination of macroeconomic pressures, market liquidations, and technical bearish signals that are driving Ethereum’s decline.
Let’s break down the key factors contributing to this drop and analyze the ETH/USDT chart for deeper insights.
Macroeconomic Pressures and Market Sentiment
The crypto market is reeling from global economic uncertainty, primarily triggered by U.S. President Donald Trump’s recent imposition of tariffs—25% on goods from Mexico and Canada, and 10% on Chinese imports. These measures, enacted in early March 2025, have sparked fears of a global trade war, with retaliatory tariffs from affected nations raising concerns about inflation and sustained high interest rates. Historically, such "risk-off" environments have negatively impacted cryptocurrencies, as investors shy away from volatile assets like Ethereum. A similar pattern was observed during the March 2020 COVID-19 market crash, where ETH saw sharp declines amid global uncertainty.
Adding to the pressure, the crypto market has faced significant liquidations. Recent data indicates over $240 million worth of ETH positions wiped out within a 24-hour period, with $196.27 million accounting for long liquidations.
This forced selling from leveraged traders has accelerated Ethereum’s price drop, with open interest in ETH futures falling, reflecting reduced market participation.
Technical Analysis: Unpacking the ETH/USDT Chart
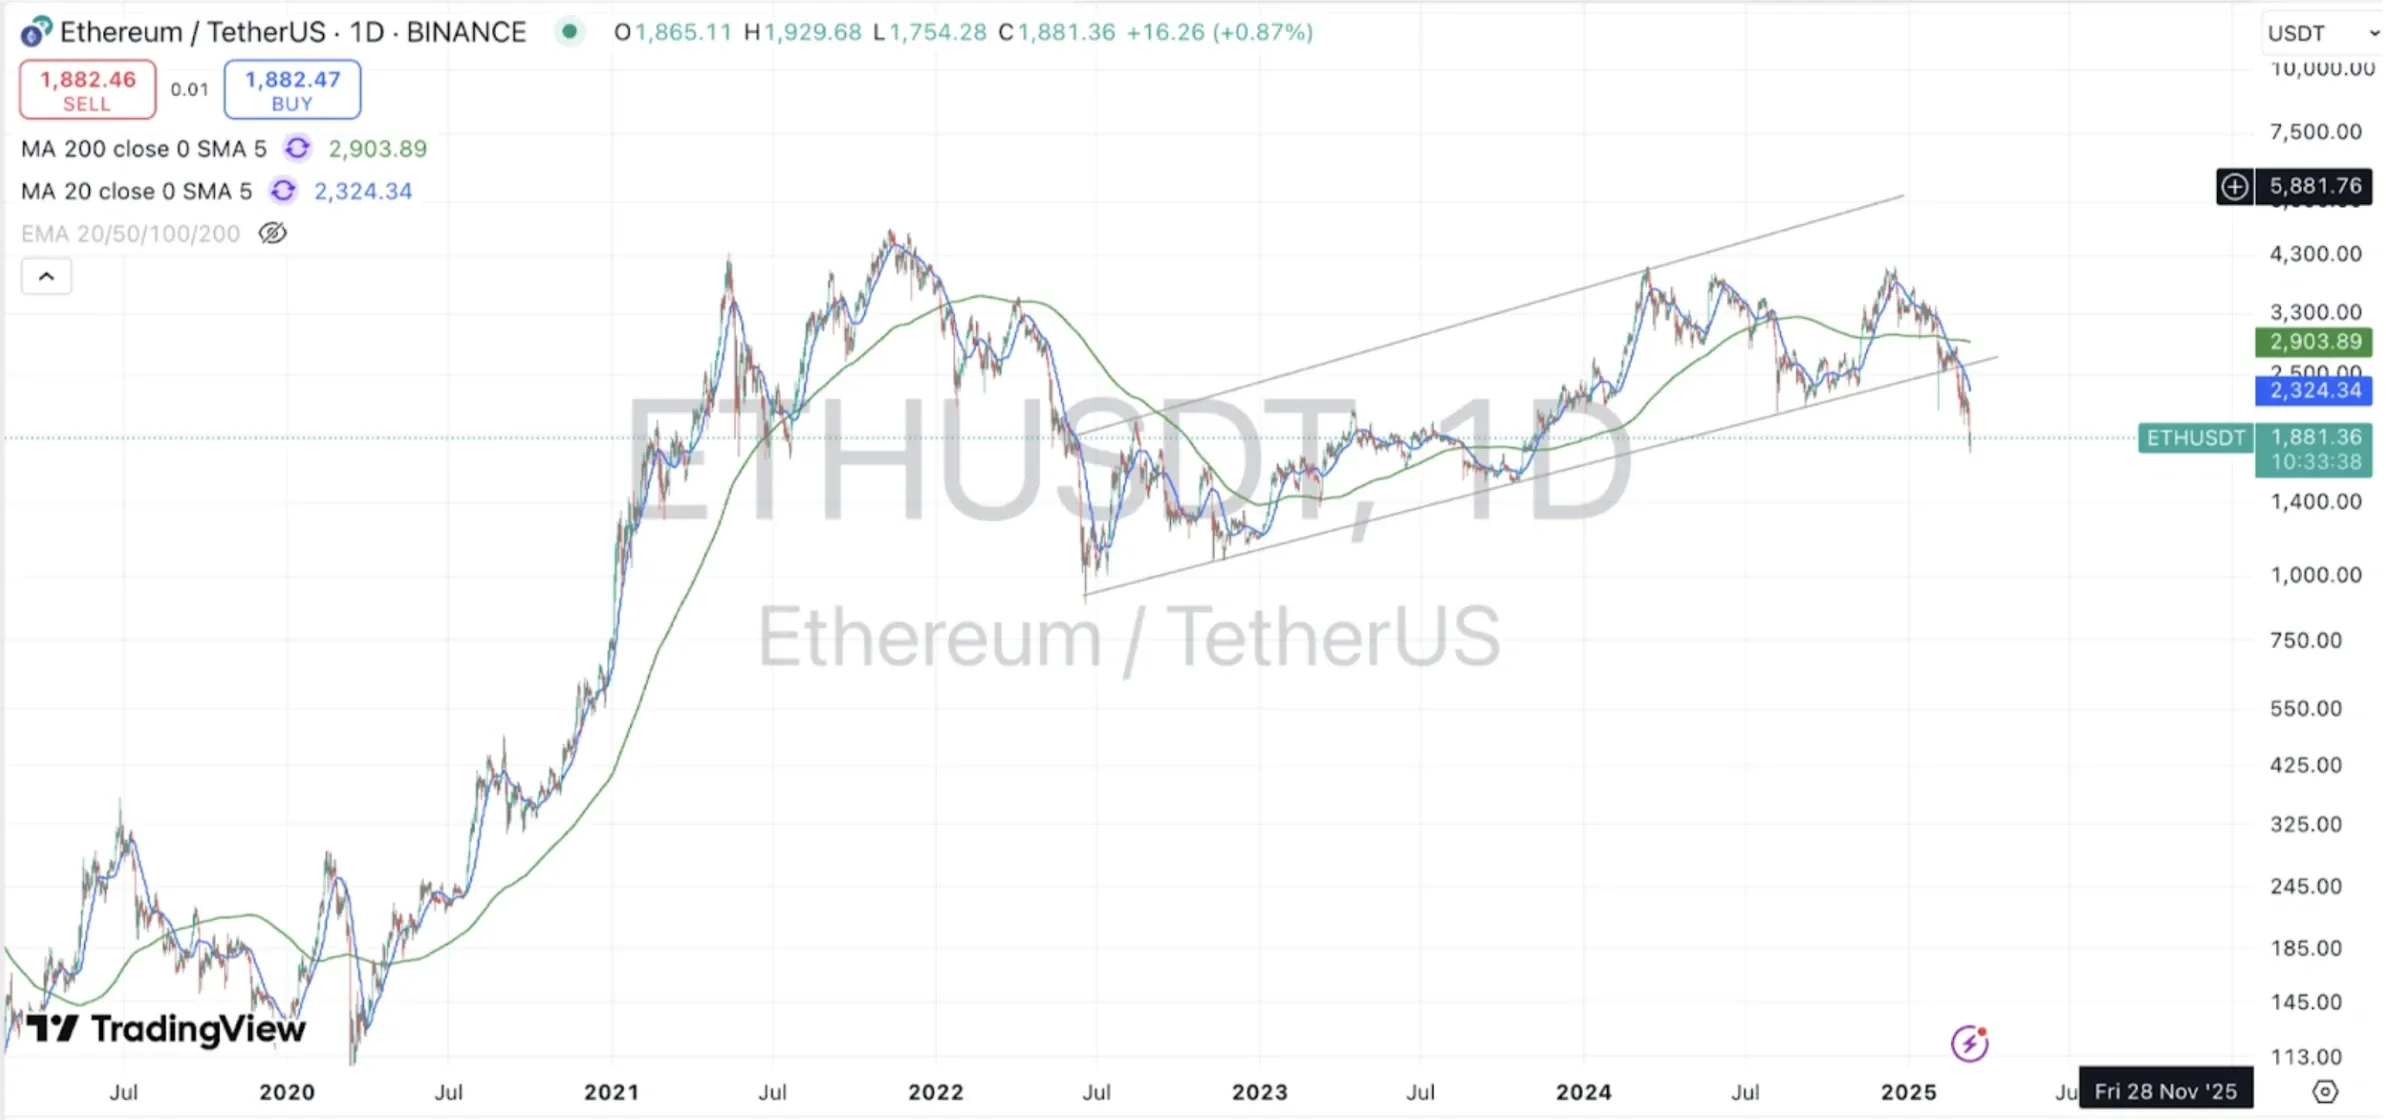
From a technical perspective, the chart above captures ETH’s long-term trend and recent decline. Key indicators and levels reveal a bearish outlook in the short term, with several critical points to watch.
Ethereum’s recovery began in 2023, with ETH climbing steadily to a recent high of approximately $3,900 in early 2025. However, the chart shows an ascending channel pattern forming since this peak, a bearish formation indicating weakening momentum. The price has since broken below the channel’s lower trendline, confirming the bearish bias, and is now trading at $1,881 (as of writing).
Moving averages (MAs) on the chart further support the bearish outlook, as the price currently sits well below the 200-day EMA (Exponential Moving Average) at $2,904 — now acting as a dynamic resistance level.
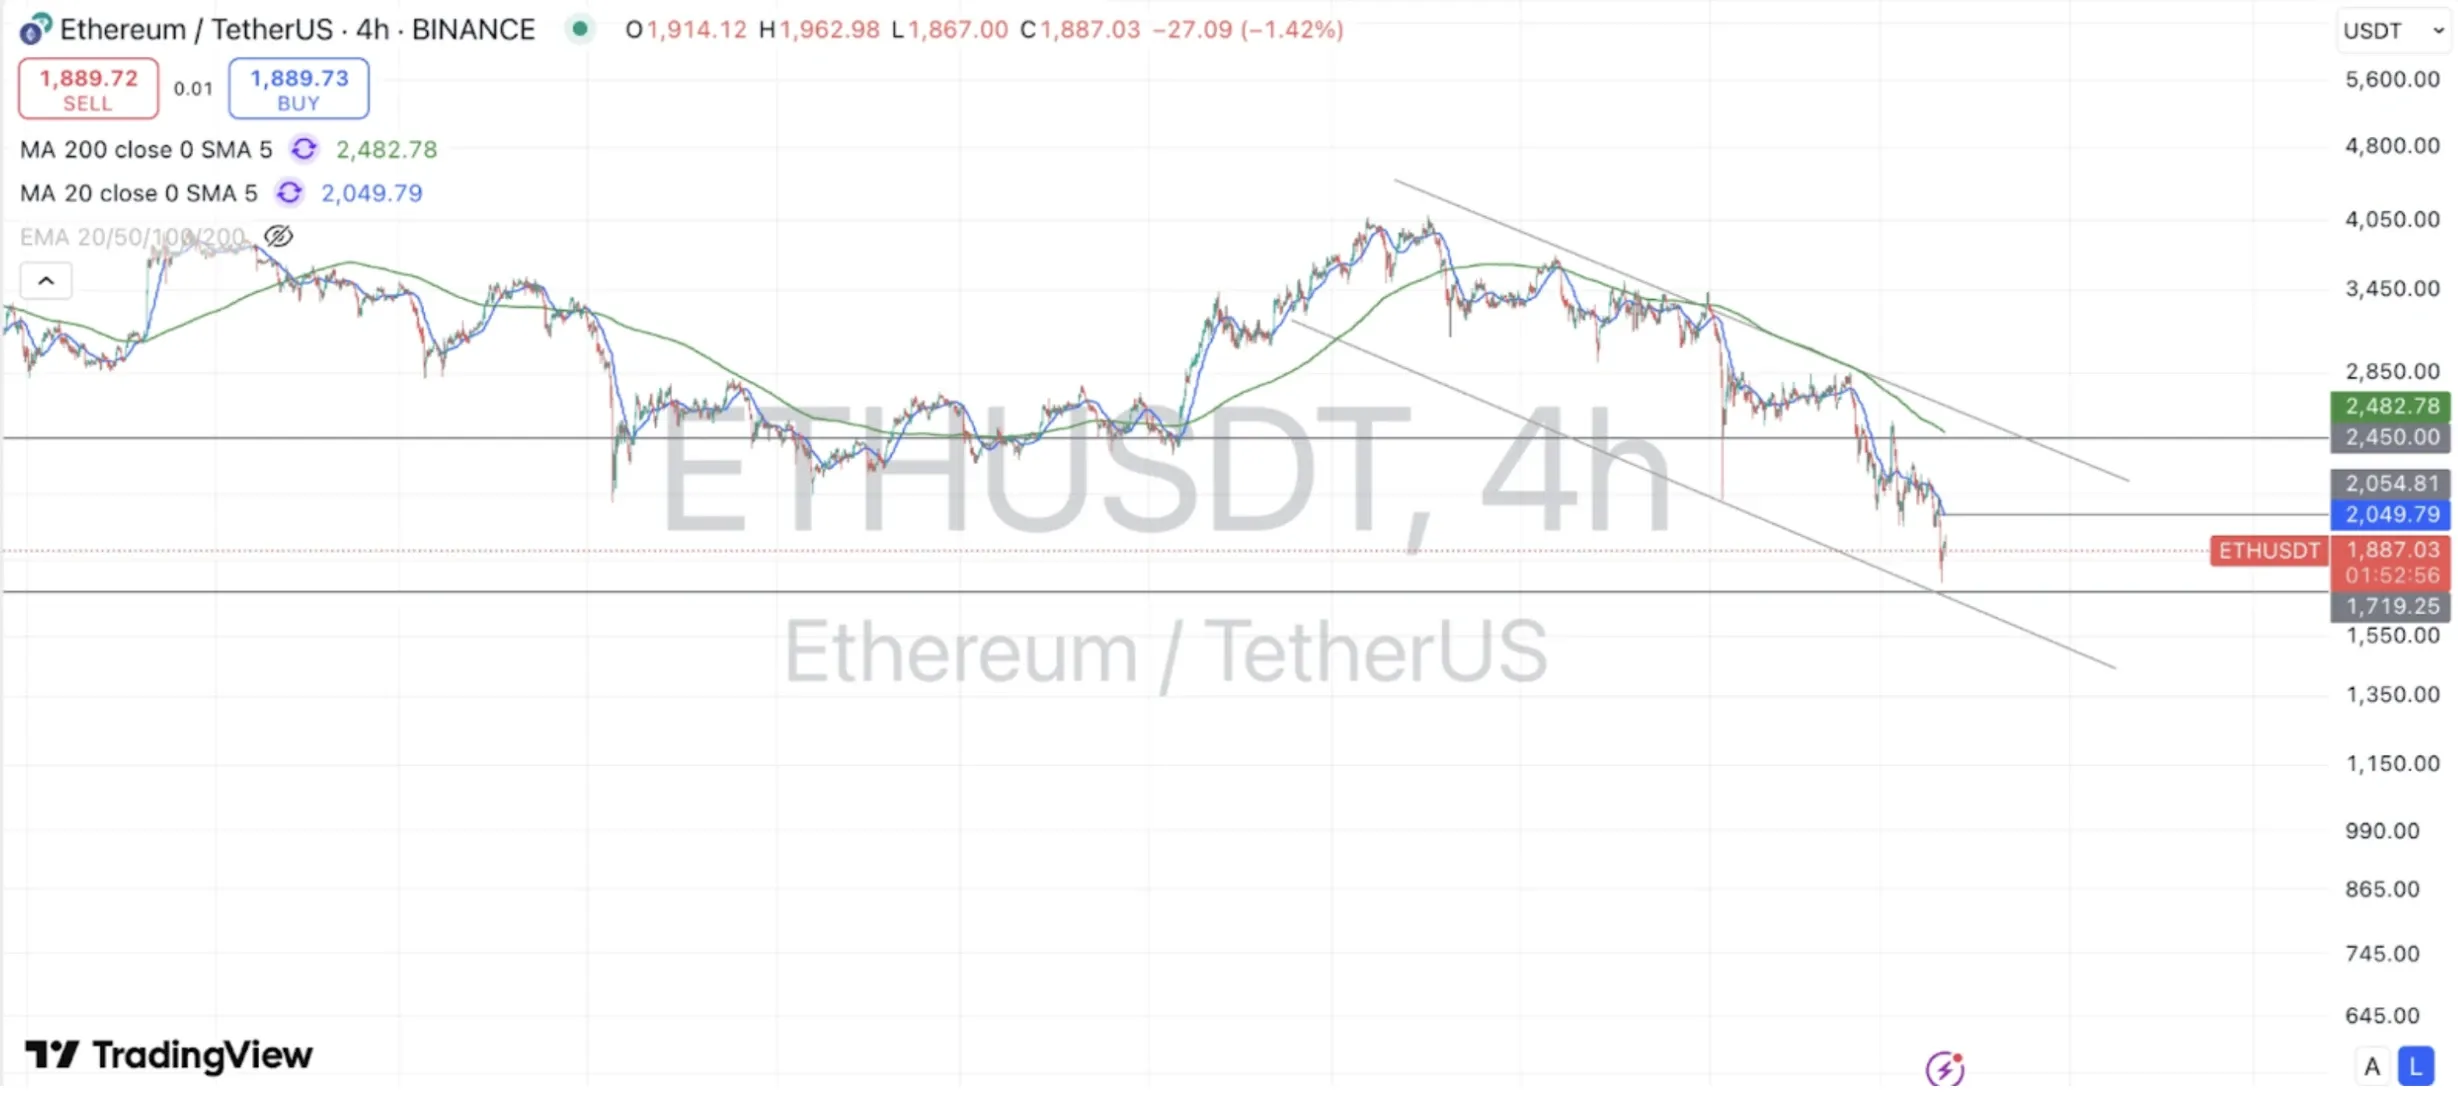
A further breakdown of the chart to a 4-hour time-frame reveals a descending channel, with the price already hitting the lower channel trendline. Historically, rebounds have taken place at such levels. A bounce from yesterday’s lows would ideally take it towards the $2000-2050 region, with further upside potentially targeting $2450.
A break above these levels would require a significant shift in market sentiment, potentially driven by a resolution to global trade tensions or renewed buying pressure.
The combined market cap of the entire crypto industry currently sits at $2.7 trillion, dropping by over 5.6% in the last 24 hours.
