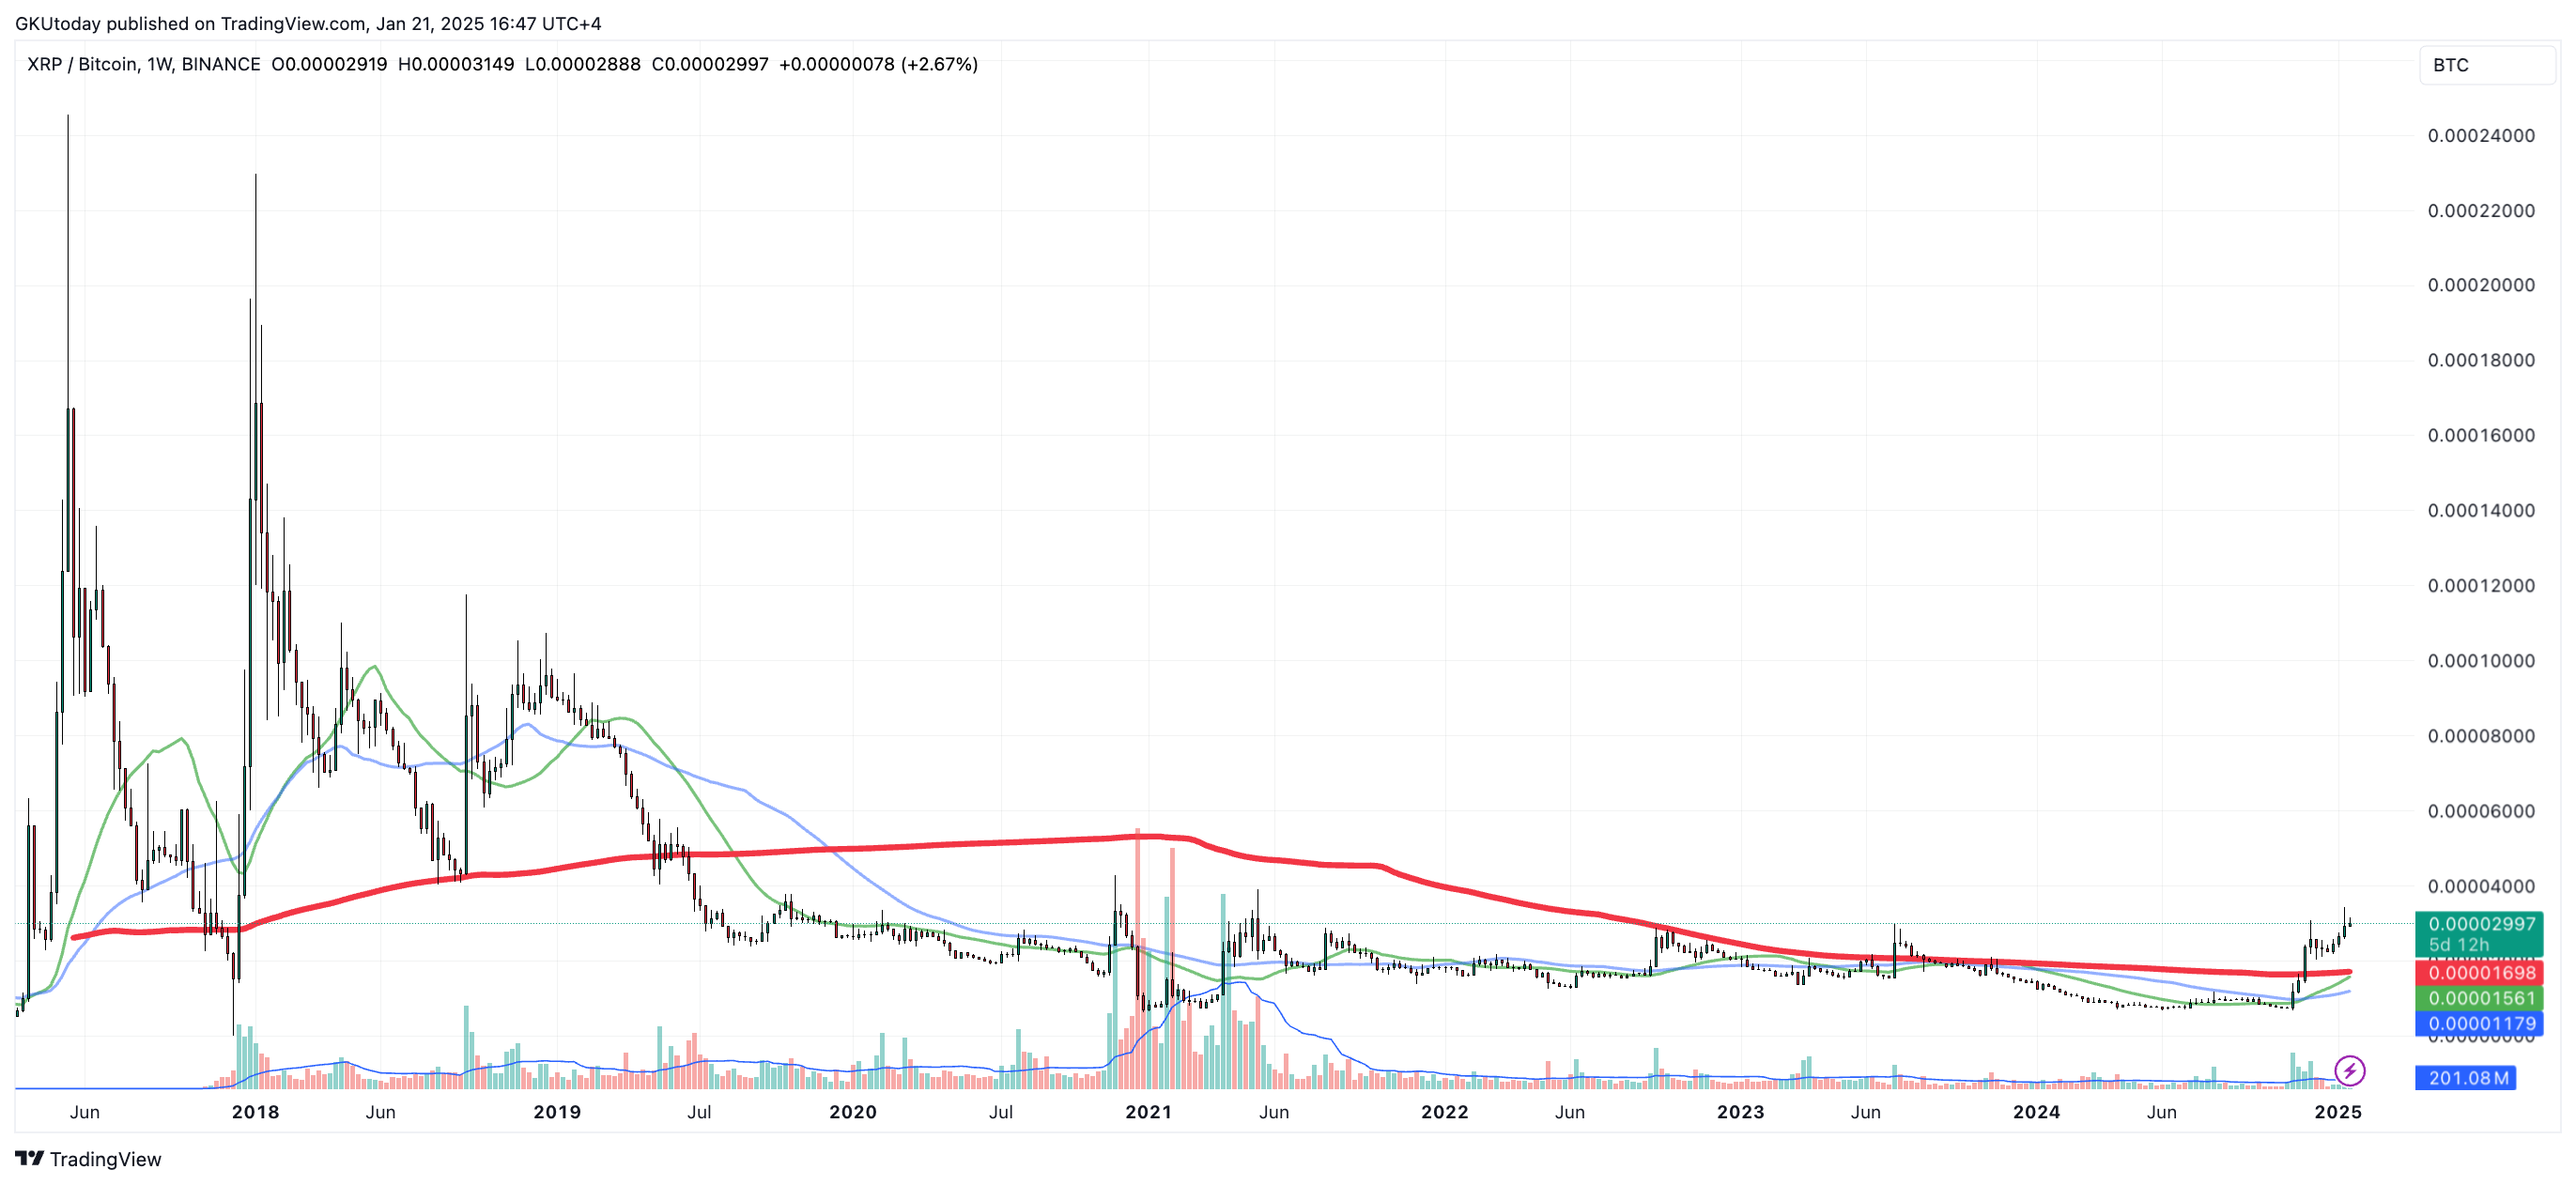


XRP on Verge of Ultra Rare Golden Cross Versus Bitcoin
 BTC
BTC
 XVG
XVG
 UOS
UOS
 XRP
XRP
 RARE
RARE
The price action of the popularcryptocurrency XRP against its leading opponent in the crypto market rankings,Bitcoin (BTC), has been a point of attraction for weeks, if not months. Since the beginning of November, XRP has gained nearly 270% against BTC, and according to technical analysis patterns, this may not be the end of the rally.
Digging into the details, it becomes clear that on the weekly price chart of XRP against Bitcoin, there is nothing less than a golden cross, with a 23-day moving average approaching a crossover with a 200-day moving average from below. This means that the medium-term price action of XRP is on the rise compared to the long term, and when these two curves cross, a golden cross will be formed.
The pattern is considered bullish and often precedes a bullish rally, although short-term deviations from this path are not excluded.

Currently,XRP is trading at 0.00003 BTC, which is the highest since the spring of 2021. However, the all-time high for this pair is still 720% above the current level. It was set in May 2017, when one XRP was equal to 0.00024 BTC. Right now, such a valuation would mean more than $25 for the popular alternative cryptocurrency.
Is $25 XRP a possibility?
Whether this is possible in the current market reality remains an open question. In the last two months, XRP has skyrocketed from $0.50 to a new all-time high of $3.40, a 700% move, and gained a massive $180 billion market cap.
If the token does indeed reach $25, its market cap will exceed $1 trillion. Of course, these valuations depend heavily on the monetary situation in the world, but at the moment such an outcome seems impossible. However, we are talking about the cryptocurrency market — where nothing is impossible.
Read original article on U.Today
