XRP is trading near $1.31, up 2.04% in the past 24 hours. This XRP price prediction looks at the $1.25 support, fresh on-chain data, and what derivatives traders are doing. Analyst Ali Charts
XRP is trading near $1.31, up 2.04% in the past 24 hours. This XRP price prediction looks at the $1.25 support, fresh on-chain data, and what derivatives traders are doing.
Analyst Ali Charts says Bitcoin, Ethereum, and XRP could all rebound, but only if their key levels hold. That "if" matters a lot right now.
What Is the XRP Price Today?
The XRP price today is $1.3147, up $0.02628 from the previous day. Here is a quick look at the numbers.
Metric
Value
Price
$1.3147
24h change
+2.04%
Market cap
$82.86 billion
Futures volume (24h)
$2.31 billion
Spot volume (24h)
$387.39 million
Open interest
$2.86 billion
Circulating supply
63.12 billion
Total supply / max supply
99.98 billion / 100 billion
Futures volume is far larger than spot volume. So derivatives traders are driving much of the action.
XRP News Today: Is the XRP Bottom In?
The main XRP news today is a post from Ali Charts saying "the bottom is in." His main point is on-chain activity.
Transaction volume on the XRP Ledger jumped last night while the price hovered near $1.25. The total value of coins moved reached about $49.7 billion. The three days before it looked tiny by comparison.
The spike came with the current rebound. That is why many traders see $1.25 as a possible floor.
A big volume day does not always mean a bottom, though. Large transfers can come from buyers, sellers, or simple wallet moves.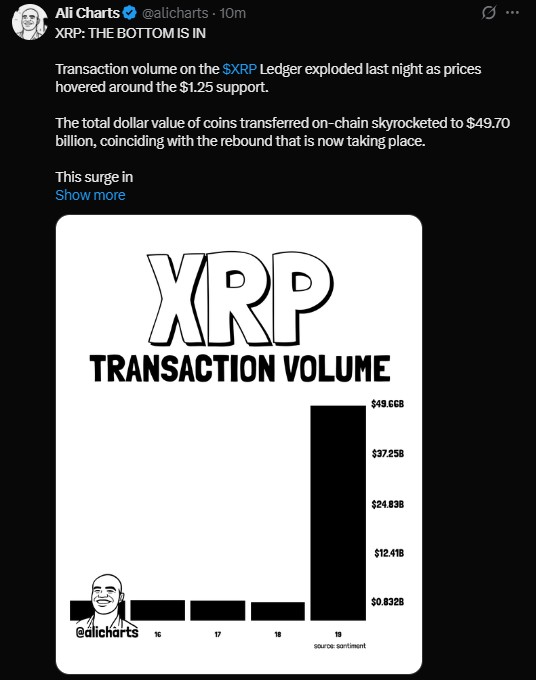
XRP Price Analysis: Is XRP Bullish or Bearish Right Now?
The daily chart still leans bearish. XRP/USDT is near $1.315 and sits below all four major moving averages.
Moving Average
Level
EMA 20
$1.3785
EMA 50
$1.3786
EMA 100
$1.3370
EMA 200
$1.3758
Descending trendlines point to steady selling pressure. The RSI is near 38.65, which shows weak momentum.
It is also getting close to oversold territory. That can sometimes slow a drop, but it is not a signal on its own.
XRP Latest News: Are Traders Long or Short on XRP?
The latest XRP news from the futures market is a rise in activity. Open interest rose 4.15% to $2.87 billion. Futures volume gained 28.08% to $2.32 billion. More money is entering the market.
The overall long/short ratio is 1.0153, which is close to balanced. Some exchanges lean more long.
Long/Short Ratio
Reading
Binance XRP/USDT (accounts)
2.7979
OKX XRP (accounts)
3.6
Binance top traders (accounts)
3.3937
Binance top traders (positions)
1.8707
Liquidations were about $5.60 million over 24 hours. Longs made up $4.63 million and shorts $971.52K.
In the last 12 hours, the picture flipped. About $955.19K was liquidated, and $888.57K of it was shorts. That fits with the bounce.
Shorter windows show $30.88K in the last hour and $185.01K over four hours.
Options volume also rose 48.04% to $3.89 million. Options open interest is $67.14 million.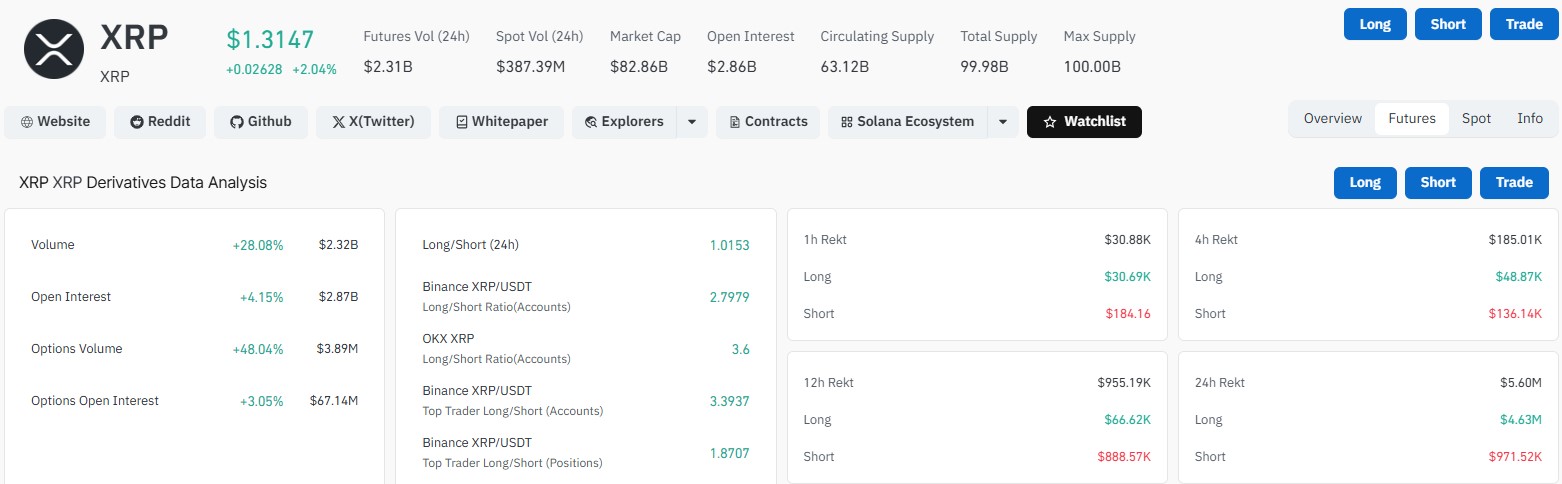
XRP Price Forecast: Will XRP Reach $2 or Drop to $1?
This XRP price forecast depends on one level. Ali Charts is watching $1.25 on the 3-day chart. Holding it could complete the right shoulder of a possible inverse head-and-shoulders pattern.
That setup still needs confirmation. A sustained close above $1.56 could open the path toward $2.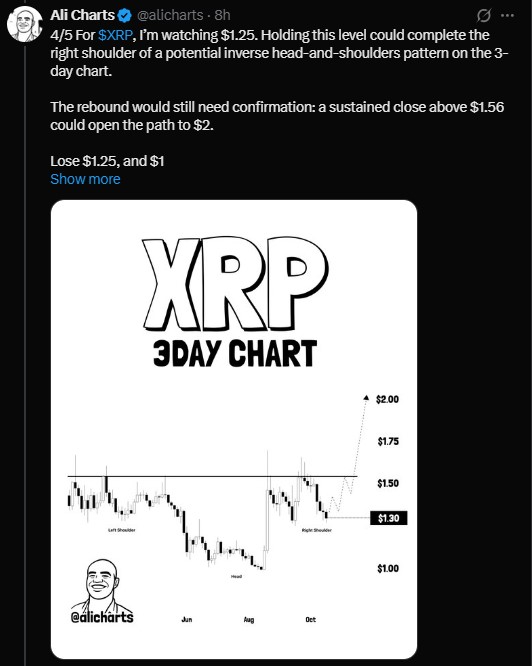
If $1.25 fails, he says $1 becomes the next level to watch.
Another technical view is similar. A break below the $1.28 to $1.25 zone could send the price toward $1.20 to $1.15.
If buyers defend support and push above $1.35 to $1.38, a move to $1.45 to $1.50 may follow.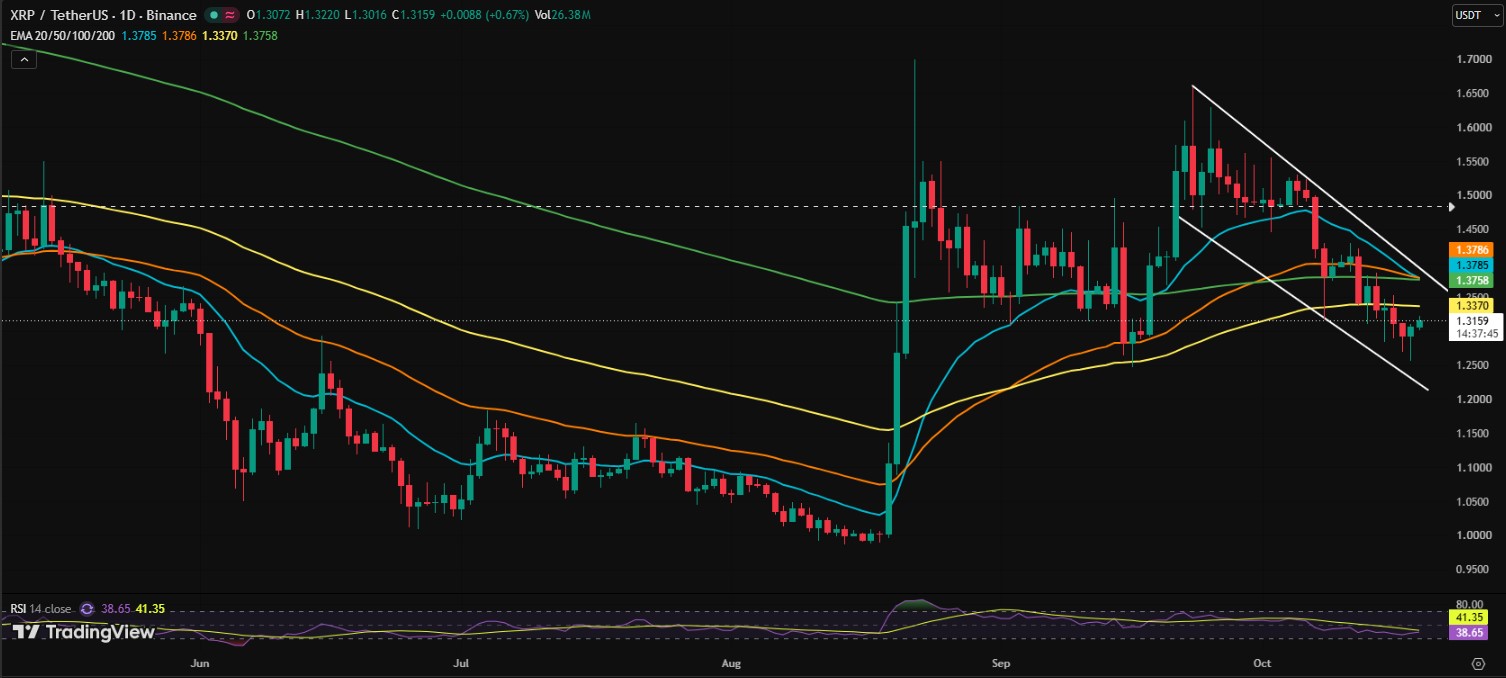
What Are the Key XRP Support and Resistance Levels?
Scenario
Trigger
Possible Target
Bullish
Hold $1.25, clear $1.35 to $1.38
$1.45 to $1.50
Strong bullish
Sustained close above $1.50
$1.55 to $1.65
Pattern breakout
Sustained close above $1.56
$2
Bearish
Break below $1.28 to $1.25
$1.20 to $1.15, then $1
For now, the short-term view is bearish to neutral. The price needs to win back the key moving averages first.
Nobody knows how this ends. Keep an eye on the $1.25, and on whether volume stays strong if the price climbs.
Disclaimer
This article is for information only and is not financial, investment, or trading advice. Crypto prices are very volatile, and you can lose money. Price targets are not guaranteed. Do your own research and speak with a licensed financial advisor before you make any decision.