Most protocol upgrades end with an announcement. Ironwood is different, because the real story started after activation. Zcash's upgrade went live without a hitch, and in the days since, more
Most protocol upgrades end with an announcement. Ironwood is different, because the real story started after activation.
Zcash's upgrade went live without a hitch, and in the days since, more than 500,000 ZEC, over $240 million, has migrated into the new shielded pool with zero network disruption.
That backdrop is why this Zcash Price Prediction August 2026 carries more weight than a usual monthly forecast: supply verification through Zcash's turnstile is still running, quietly confirming the migration held up.
Can that improving confidence translate into a bullish breakout for ZEC during August?
Why Are Traders Suddenly Optimistic About Zcash?
Sentiment has shifted since Ironwood activated.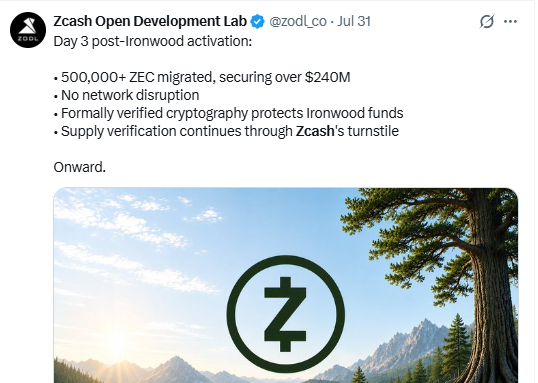
Migrating half a million coins without a single disruption is the kind of execution that builds trust, and the Zcash Foundation's engineering notes back it up, pointing to full support for the new transaction format and several security fixes shipped alongside it.
None of that is a price catalyst on its own. Traders have watched the network prove itself; what they're still waiting on is the chart doing the same.
Are ZEC Derivatives Traders Buying the Recovery?
Funding sits modestly positive, around 0.0087%, pointing to a market leaning long without euphoria.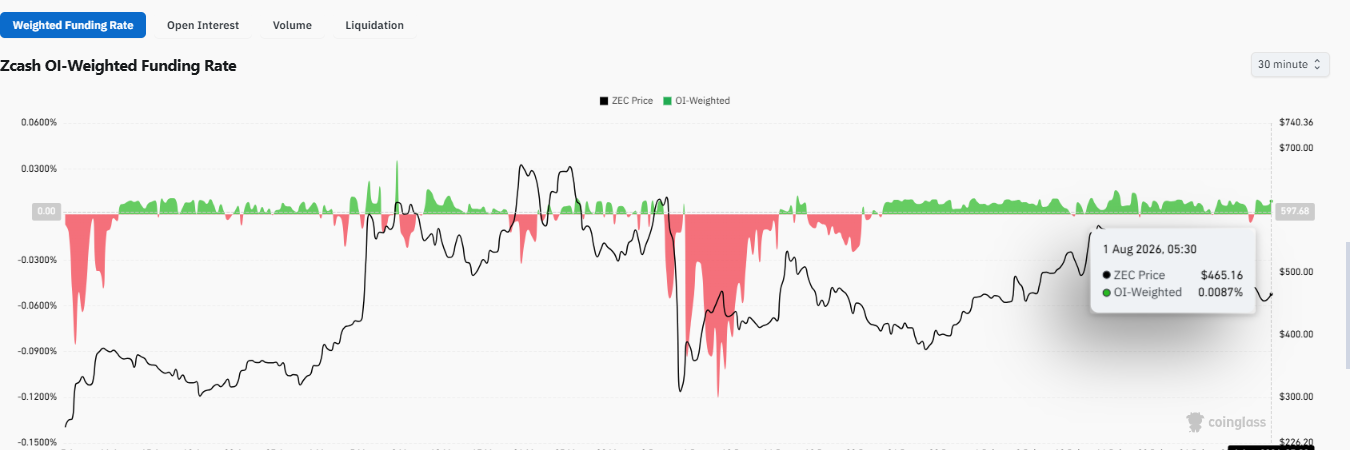
Open interest has softened to approximately $770 million from earlier peaks, reflecting a healthier reduction in speculative leverage rather than aggressive new positioning.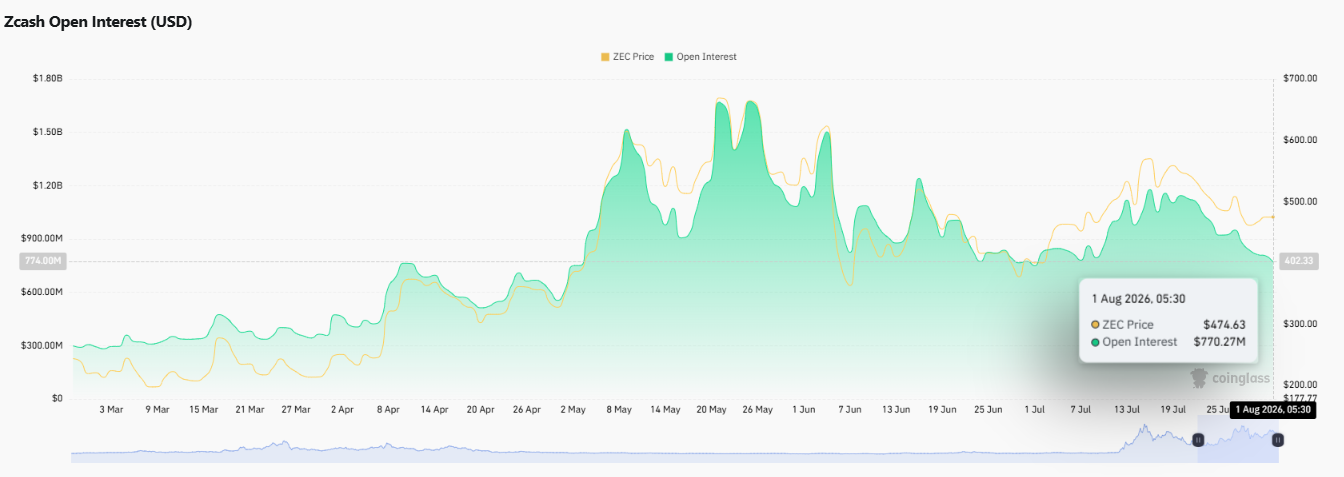 The positioning split is worth noting. Binance's account-level long/short ratio is 0.6875, and OKX's is 0.95, both below 1, showing retail accounts remain cautious.
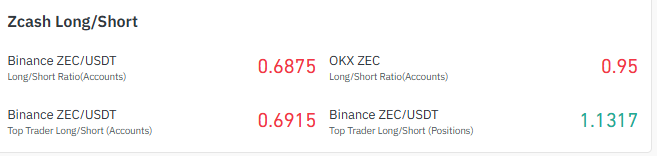 Binance's top traders differ: their account ratio is 0.6915, but their position-weighted ratio jumps to 1.1317; the traders with the biggest bets are net long even while smaller accounts hold back.
Liquidations reinforce that split. Zcash flushed $955.56K in total liquidations over 24 hours, $717.67K of that from longs and an earlier leverage reset.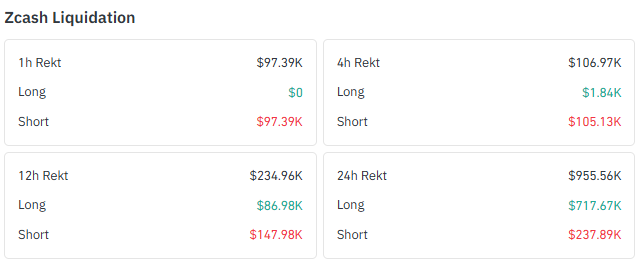
The more recent hours flipped: the last 4 hours saw $105.13K in short liquidations against just $1.84K in longs, and the past hour was shorts-only at $97.39K.
Put together, derivatives sentiment reads cautiously bullish rather than euphoric: bigger positions are leaning long, smaller accounts are still hedged, and leverage is cleaned out rather than stacked.
Data source: Coinglass
What Does ZEC's Recent Price Action Say?
ZEC is essentially flat over the past day, up 0.97%, after pulling back 4.78% over the past week.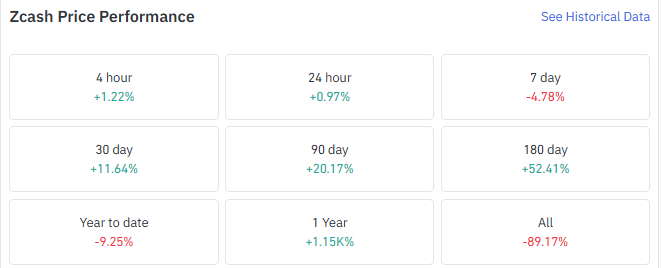
Zoom out, and it looks stronger: up 11.64% over 30 days, 20.17% over 90 days, and 52.41% over 180 days.
Year to date, though, ZEC is still down 9.25%; a strong medium-term run alongside a rough week is what consolidation after a big move typically looks like.
Is ZEC's Weekly Ascending Triangle Ready to Break?
On the TradingView weekly chart, $ZEC trades around $465, inside a broadascending trianglethat's been building for months.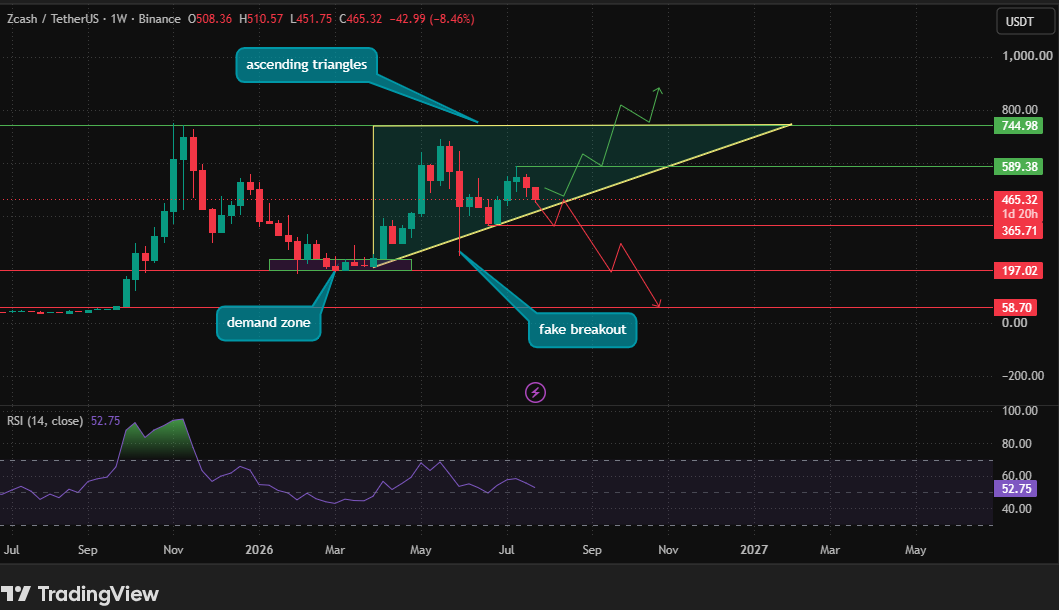 A rising trendline off the lows meets a flatter ceiling above, and price is now working toward where those two lines converge.
The weekly RSI sits at 52.75, essentially neutral, not a chart screaming momentum in either direction.
$589.38 is the first resistance above the current price, with $744.98 marked further out as the triangle's longer-term reference if the breakout holds.
The chart also flags a fake-breakdown risk: a dip below the rising trendline that reverses back into the pattern.
If the structure genuinely fails and trades below $365, then the downside levels are $197.02 and then $58.70; they stand as deeper marked support.
Can Zcash's Daily Chart Confirm the Move?
The TradingView daily chart tells a tighter version of the same story. ZEC trades around $465.94, compressed inside a symmetrical triangle that produced a fake breakdown in early June.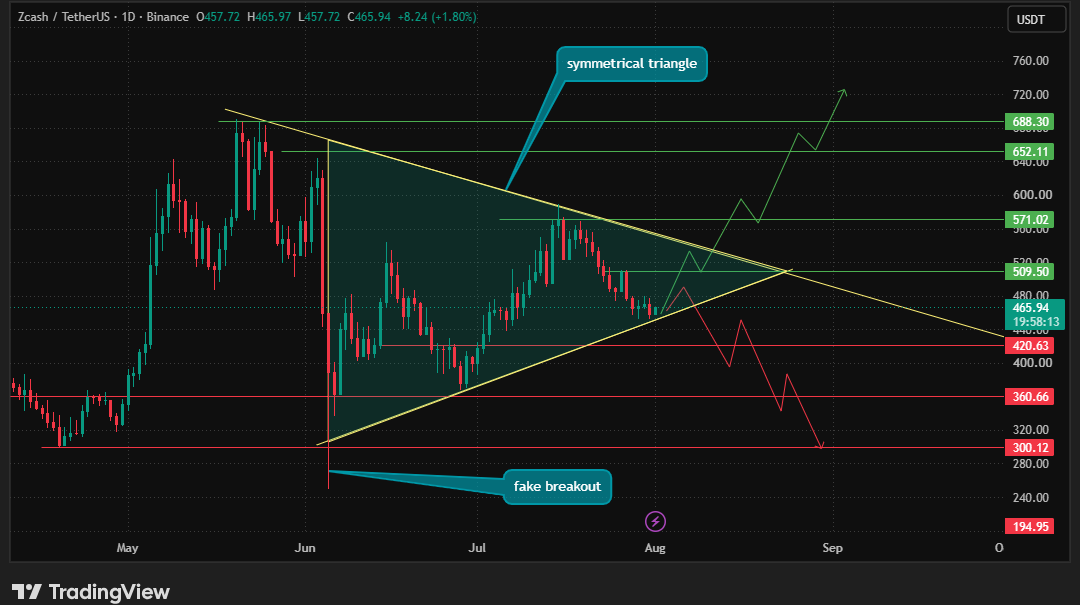
A quick dip below the lower trendline that reversed just as fast and pulled price back inside the pattern, the kind of shakeout that often clears weak hands before a real move.
$509.50 is the first daily resistance. A close above it opens the door to $571.02, then $652.11 and $688.30, marked levels rather than guaranteed targets.
On the downside, $420.63 is the level that matters most; losing it points back toward $360.66, and a deeper breakdown would put $300.12 and eventually $194.95 in view.
Where Does That Leave the Daily Bias?
NEUTRAL. The fake breakdown recovery and cautiously bullish derivatives positioning both lean constructive, but with price still trading inside the triangle and no resistance level broken yet, the daily chart hasn't confirmed a direction.
Scenario
Trigger
Price Outlook
Bullish
Buyers reclaim $509.50 on the daily chart, and the weekly ascending triangle breaks above $589.38 with sustained momentum.
Such a move would indicate that improving confidence following the Ironwood upgrade is beginning to reflect in market sentiment. If the breakout holds, ZEC could target $571.02, followed by $652.11, while $744.98 becomes the next major weekly resistance rather than an immediate price target.
Base Case
Price continues to trade between $420.63 and $509.50, with neither buyers nor sellers gaining a decisive advantage.
This remains the most likely scenario for August. The daily symmetrical triangle and weekly ascending triangle would continue to compress, suggesting the market is building energy while traders wait for a confirmed breakout before increasing exposure.
Bearish
ZEC closes below $420.63, followed by confirmation that the weekly ascending triangle has failed instead of producing another fake breakdown.
A loss of key support would weaken the current technical structure and could accelerate selling pressure toward $360.66 and $300.12. If the broader weekly pattern breaks down completely, $197.02 becomes the next significant long-term support zone.
Ironwood Improved Confidence — Now Price Has to Confirm It
As per coingabbar analyst Ironwood did what it needed to do: it activated cleanly, migrated more than half a million ZEC without incident, and gave Zcash a stronger security story heading into August.
None of that guarantees a rally on its own.
What's left is the chart's job. A daily close above $509.50, or a genuine weekly breakout past $589.38, would be the first real evidence that the market is pricing in what just happened on-chain.
Until then, ZEC sits in a neutral, wait-and-confirm position, better fundamentals looking for a technical reason to matter.
Disclaimer: This analysis is for informational purposes only and does not constitute financial advice. Cryptocurrency markets are volatile, and readers should conduct their own research before making investment decisions.