


Bitcoin Bottomed? 3 Powerful On-Chain Signals Confirm Sellers’ Exhaustion
BTC
Key Highlights
- Bitcoin stabilizes near $77,800 as consecutive spot ETF inflows signal institutional accumulation.
- Sharpe Ratio rebounds from -43 to +20, indicating improving market risk appetite.
- Retail selling pressure fades as short-term holder supply drops below the critical 7% level.
- Inter-exchange flows show smart money positioning for upside via derivatives markets.
- $73,700 remains the key support, while $96,000 stands as the potential upside target.
Bitcoin is currently trading around $77,800, showing signs of stabilization despite being down roughly 11% year-to-date. The market is now entering a critical transition phase, supported by a wave of consecutive spot ETF inflows, signaling strong institutional interest and steady capital returning to the asset.
 Bitcoin (BTC) Price/Source: Coinmarketcap
This consistent inflow into spot Bitcoin ETFs suggests that large players are quietly accumulating, even as broader sentiment remains cautious.
At the same time, fresh on-chain data is pointing toward a potential shift — from heavy selling pressure to a more constructive recovery phase.
On April 23, 2026, prominent analyst Ali Charts highlighted three key indicators that collectively suggest Bitcoin may be forming a bottom and preparing for the early stages of a bullish reversal.
Sharpe Ratio Rebounds — Risk Appetite Returning
One of the clearest signs of improving sentiment is the recovery in the Sharpe Ratio, a metric that measures returns relative to risk.
The ratio recently dropped to an extreme low of -43, reflecting deep fear and a strong risk-off environment across the market. However, it has since rebounded sharply to around +20.35.
 Bitcoin’s Sharpe Ratio/Credits: @alicharts (X)
Such a move out of deeply negative territory typically signals that the worst of the volatility has already been priced in, and the market is transitioning back toward a healthier risk-reward environment.
Retail Selling Pressure Is Drying Up
Another strong bottoming signal comes from the behavior of short-term holders.
The percentage of realized cap held by investors who bought Bitcoin within the last 30 days has now fallen below 7% — a level that historically aligns with market bottoms.
 BTC Percentage Realized Cap/Credits: @alicharts (X)
This indicates that retail participation has significantly cooled and that most weak hands have already exited the market. As a result, supply is increasingly concentrated among long-term holders, who are less likely to sell during periods of uncertainty.
Smart Money Positioning for Upside
A third important signal comes from the Inter-Exchange Flow Pulse, which tracks how Bitcoin moves between spot and derivatives exchanges.
Recent data shows BTC flowing from spot exchanges toward derivatives platforms. This typically suggests that traders are using Bitcoin as collateral to open leveraged positions — often a sign of growing confidence in future price appreciation.
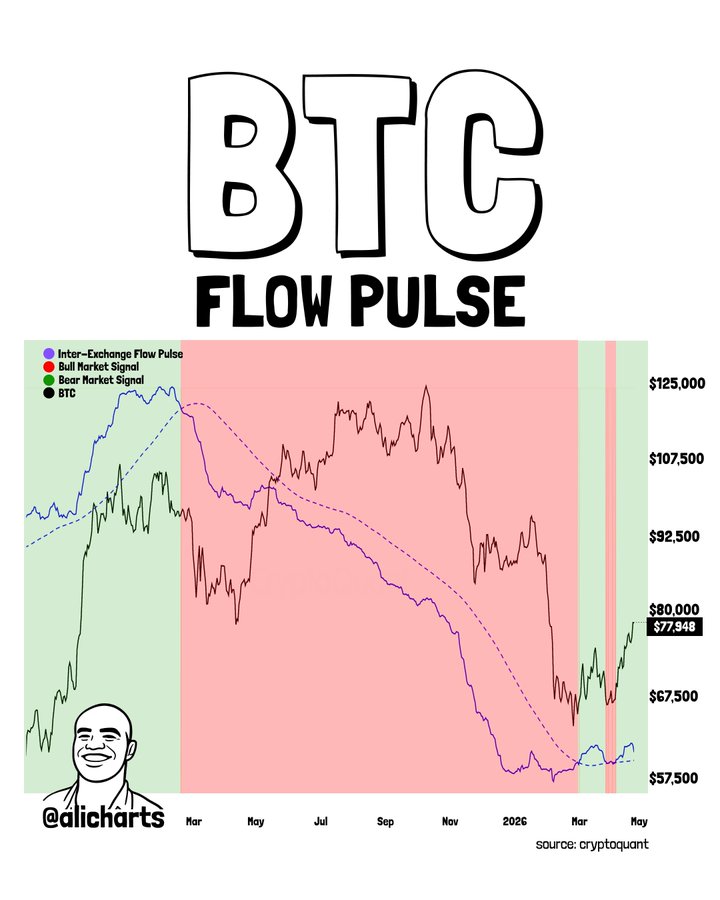 BTC Flow Pulse/Credits: @alicharts (X)
In simple terms, more experienced market participants appear to be positioning for a potential upside move.
Technical Outlook: MVRV Bands in Focus
From a technical standpoint, the MVRV (Market Value to Realized Value) Pricing Bands provide a clear roadmap for what comes next.
Bitcoin has successfully reclaimed the -0.5 MVRV band near $73,700, which now acts as a crucial support level.
 BTC MVRV Pricing Bands/Credits: @alicharts (X)
As long as this level holds, the next likely move is a mean reversion toward the $96,000 range. However, if Bitcoin breaks below this support, the bullish setup would weaken, opening the door for a deeper pullback toward the $55,000 realized price zone.
Why This Setup Matters
The combination of a recovering Sharpe Ratio, fading retail selling pressure, and increasing confidence from sophisticated market participants suggests that a large portion of the bottoming process may already be complete.
With retail largely sidelined and institutional capital gradually stepping in — as seen through ETF inflows — Bitcoin appears to be transitioning from a high-uncertainty phase into a potential recovery cycle.
Bottom Line
Bitcoin is showing multiple signs of stabilization after a period of intense volatility.
The key level to watch remains $73,700. Holding this support could pave the way for a move toward $96,000, while a breakdown would delay recovery and increase downside risk.
For now, the data points to one clear narrative: selling pressure is fading, and the foundation for the next bullish phase may already be forming.
FAQ Section
Is Bitcoin forming a bottom right now?
On-chain indicators like the Sharpe Ratio recovery and declining retail supply suggest Bitcoin may be in a bottoming phase, though confirmation depends on holding key support levels.
Why are ETF inflows important for Bitcoin?
Spot ETF inflows indicate institutional demand. Consistent inflows often signal accumulation by large investors, which can support long-term price growth.
What is the key support level for Bitcoin?
The critical level to watch is around $73,700. Holding this level keeps the bullish recovery scenario intact.
What is the next target for Bitcoin if it rebounds?
If the current structure holds, Bitcoin could move toward the $96,000 level based on MVRV mean reversion.
What happens if Bitcoin loses $73,700?
A breakdown below this level could invalidate the bullish setup and potentially lead to a deeper correction toward the $55,000 range.
Disclaimer: The views and analysis presented in this article are for informational purposes only and reflect the author’s perspective, not financial advice. Technical patterns and indicators discussed are subject to market volatility and may or may not yield the anticipated results. Investors are advised to exercise caution, conduct independent research, and make decisions aligned with their individual risk tolerance.
Read Also: Ethereum Bull Case Strengthens: Institutional ETH Accumulation + 2017 Fractal Setup.
