


Bullish MACD Flash: Is DOGE Set to Hit $0.70 Next?
 CONV
CONV
 DOGE
DOGE
DOGE
DOGE
 CVG
CVG
 DIVER
DIVER
Key Insights:
- Weekly MACD crossover signals trend shift, echoing past rallies exceeding 200% gains.
- DOGE breaks 146-day channel and retests support, indicating possible bullish continuation.
- Whale accumulation and breakout from multi-year wedge support new cycle expectations.
Dogecoin (DOGE) has recorded a bullish Moving Average Convergence Divergence (MACD) crossover on the weekly chart. This is where the MACD line crosses above the signal line, often associated with the beginning of an upward trend.
Analysts are paying close attention to this type of pattern, which has previously marked the start of major price movements. Past MACD crossovers have led to rallies of over 200%.
Dogecoin 4-Year chart | Source X
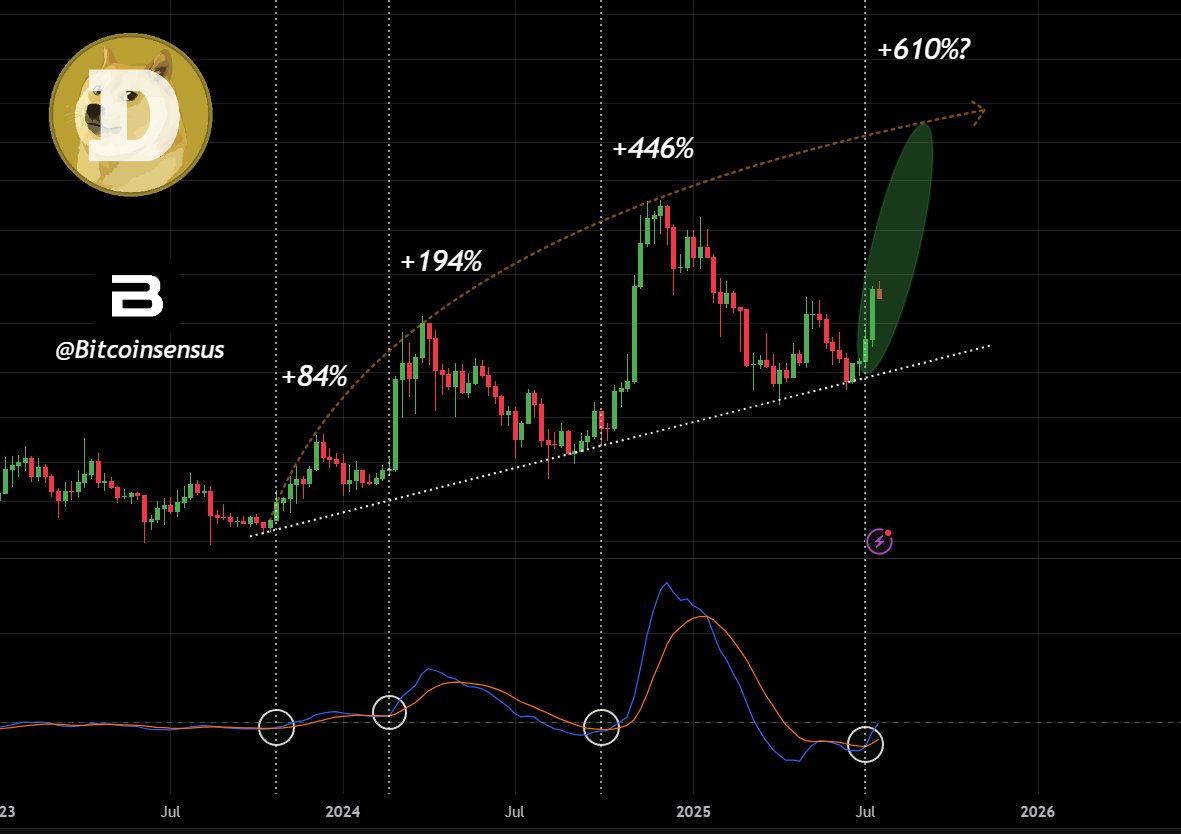
According to analyst MikyBull Crypto, the current MACD setup is the third crucial crossover in less than two years. These previous crossovers were followed by steep price gains and technical breakouts, which some view as early signs of trend continuation.
Breakout From 146-Day Channel Confirms Bullish Setup
DOGE has broken out of a 146-day ascending channel, a pattern that started forming in early March. The breakout occurred in late July and was followed by a retest near $0.26, which analysts say confirmed the move.
Trader Tardigrade pointed out that the coin respected the channel boundaries for several months. It formed higher lows and tested the upper range repeatedly before the breakout.
Following the retest, DOGE stabilized just above the channel resistance, which some analysts say supports the bullish continuation pattern. Historical trends show that when similar breakouts occurred in the past, DOGE entered multi-week rallies, often with increasing volume and trading activity.
Multi-Year Wedge Pattern Break Suggests New Cycle
Moreover, during the monthly timeframe, Dogecoin broke out of a descending wedge that lasted over three years. This pattern compressed the price between lower highs and a steady support level.
Some have interpreted its recent breakout as the beginning of what they call “Cycle 3,” referring to previous periods where breakouts led to new price highs. Several market watchers viewed the wedge, which formed between mid-2022 and mid-2025, as a key structural formation.
Dogecoin Price 1-Month Chart Source: X
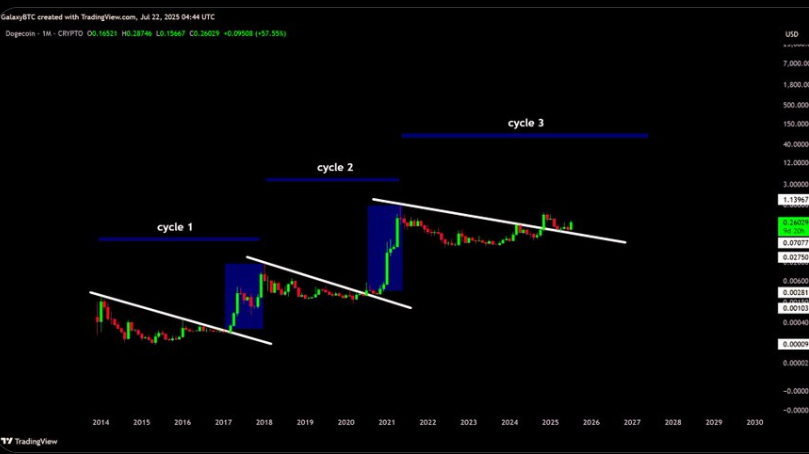
Analysts argue that both of the earlier cycles began with similar wedge breakouts and eventually moved to all-time highs. Current market behavior follows the same trajectory, with price action and volume suggesting increased interest.
Whale Accumulation and Price Forecasts
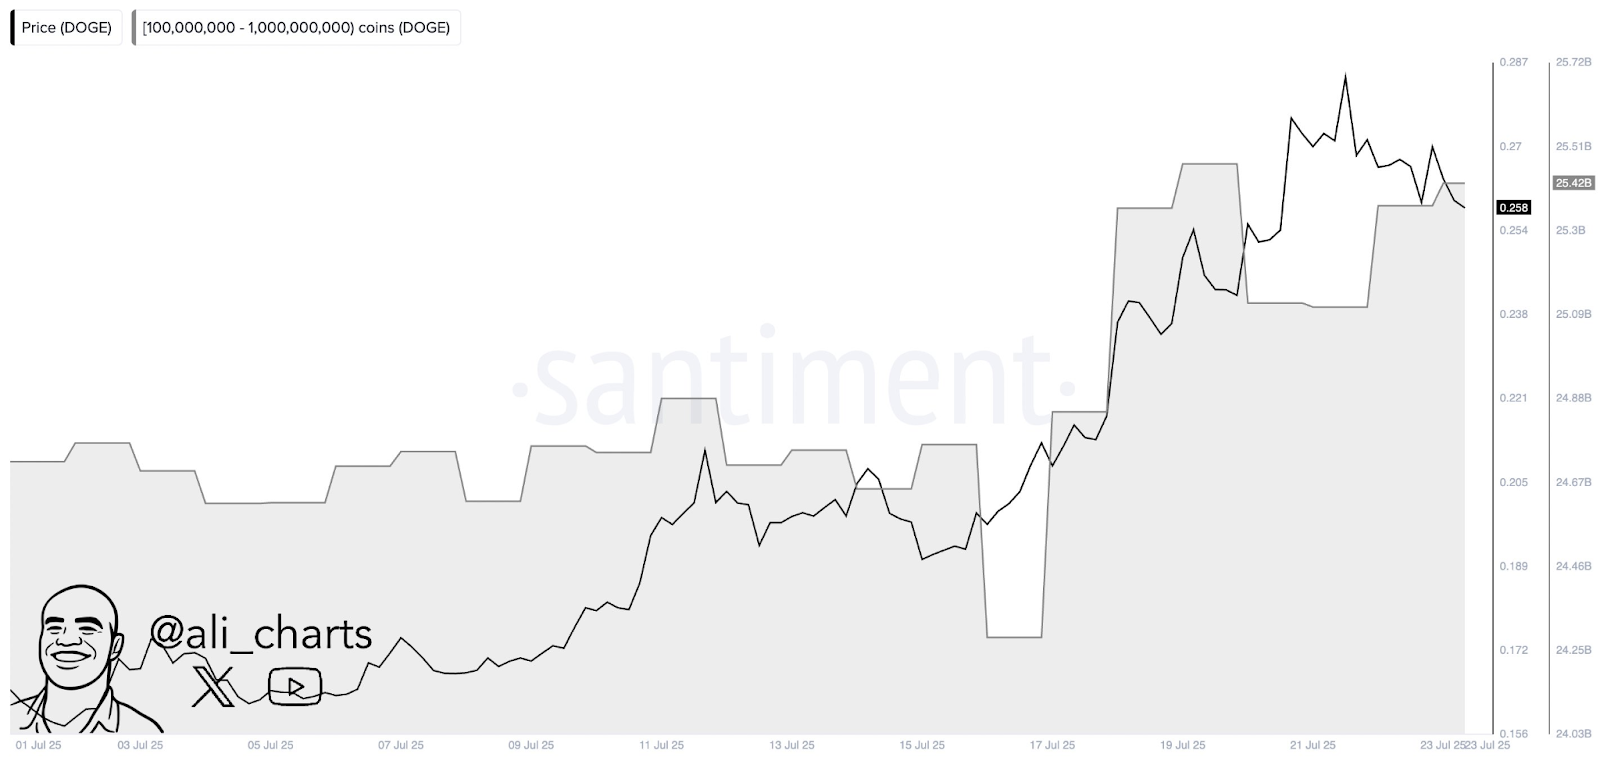
Data from @ali_charts over the past 48 hours indicates that over 310 million DOGE have been purchased by large holders, often referred to as whales. This level of accumulation followed a brief dip in price and is a possible signal of renewed buying interest.
Notably, the daily chart shows DOGE continuing to make higher lows even as price corrections occur, showing sustained pressure from buyers. Experts are watching for potential intermediate targets at $0.52 and $0.68. Based on the recent breakout and historical price moves, several analysts predict a possible move to $1.
Dogecoin 1-Month Santiment price | Source X
At press time, Dogecoin is trading at $0.2349, with a 24-hour volume of $5.4 billion. The asset has been down 8.76% in the last 24 hours but has remained up over 26% for the week.
| DISCLAIMER: The information on this website is provided as general market commentary and does not constitute investment advice. We encourage you to do your own research before investing. |
