


Bitcoin Drops to $115K as Bears Eye a Deeper Market Drop
BTC
 X
X
 DROPS
DROPS
 READ
READ
 HIGHER
Key Insights:
- Bitcoin tests $115K support as traders watch for breakdown that may trigger drop to $111,000.
- Liquidity clusters below $116K and above $120K signal increased risk of sudden market volatility.
- Bearish flag pattern weakens as Bitcoin fails to reclaim $116K, raising doubts about short-term stability.
Bitcoin (BTC) has slipped to $115, placing it near a support level that analysts say is crucial for the short-term outlook. The drop comes after the asset failed to hold above the $116,000 zone, with sellers gaining control.

Meanwhile, the level around $115,000 is now being watched closely as a breakdown could lead to further losses. According to market data from CryptoVIPsignal, the resistance continues to build between $118,000 and $118,500.
Bitcoin price chart | Source: X
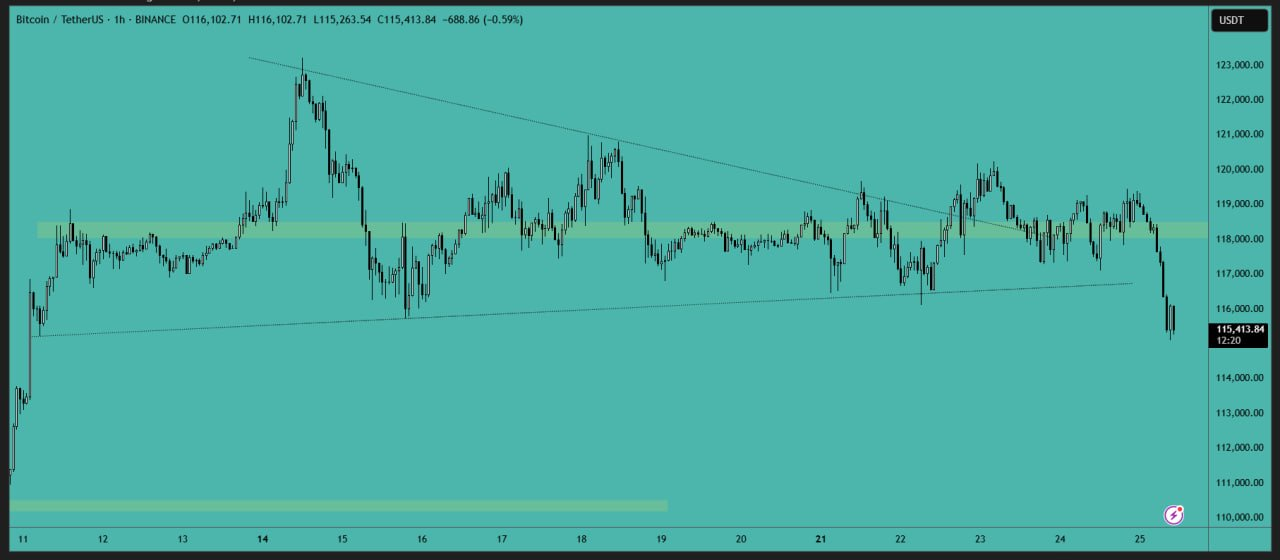
However, this zone also lines up with key Fibonacci levels, making it difficult for buyers to push past. If Bitcoin cannot break above this range, the path toward $111,000 may remain open.
Price and Liquidity Clusters Suggest Higher Volatility
At the time of writing, Bitcoin was trading at $115,270, after falling 2.56% in the past 24 hours. On-chain data shows large liquidity pools below the $116,000 mark. These clusters, made up of leveraged long positions, are at risk if selling continues.
Notably, trading volume has increased to over $89 billion in the last 24 hours, pointing to elevated activity as traders react to shifting conditions. Market watchers point to a sell-side liquidity pool forming just below $116,000, raising concerns about a possible cascade of downward pressure.
Technical patterns signal a breakdown as sentiment stays cautious.
Bitcoin's current chart pattern shows a weakening bullish flag on the 4-hour timeframe. This setup often indicates a potential continuation, but current price action is challenging that outlook. The sideways movement seen since mid-July, with Bitcoin peaking at $123,100, has raised doubts among investors.
However, analysts watching correlation trends across altcoins say a move below $111,000 could shake confidence in the broader market. Ethereum and other digital assets may also face added pressure if Bitcoin fails to hold current levels.
| DISCLAIMER: The information on this website is provided as general market commentary and does not constitute investment advice. We encourage you to do your own research before investing. |
