


Bitcoin Braces for Key Macro Week — Fed Decision, PCE and GDP — Will BTC Test $83K?
 BTC
BTC
Key Highlights
- Bitcoin faces one of the heaviest US economic calendars of 2026, headlined by the Federal Reserve Rate Decision, PCE Inflation, and Q1 GDP prints.
- BTC is approaching a critical technical confluence zone between $79,000–$83,000, where strong supply clusters and cost basis levels could decide the next major move.
- Analyst warns that Bitcoin’s reaction at the $83K resistance will be key to watch in the coming days.
- Dovish Fed signals or softer inflation/GDP data could act as a major catalyst for Bitcoin to break higher, while hotter data may trigger a short-term pullback.
Bitcoin is currently trading at $78,009, up 0.48% in the last 24 hours and 3.77% over the past week, with a market capitalization exceeding $1.56 trillion. As the new week going to begin, the crypto market is staring down a high-impact lineup of US economic data — and one prominent on-chain analyst is warning that BTC is approaching a decisive technical battleground.
 Bitcoin (BTC) Price/Source: Coinmarketcap
CryptoQuant contributor and market decoder @Darkfost_Coc has spotlighted both the fundamental and technical catalysts in two timely posts. Here’s a deep dive into what they mean for Bitcoin’s next move.
The “Big Week” for US Macro Data: Why It Matters for Bitcoin
Bitcoin Braces for Fed Rate Decision, PCE & Q1 GDP This Week – Will $BTC Test $83K?
This week is packed with market-moving releases that will shape expectations for interest rates, inflation, growth, and overall risk appetite. Here’s the full schedule highlighted by the analyst:
- Monday: Dallas Fed Manufacturing Index
- Tuesday: ADP Employment Change, S&P/Case-Shiller Home Prices, CB Consumer Confidence, Money Supply
- Wednesday: Building Permits, Durable Goods Orders, Housing Starts + Federal Reserve Interest Rate Decision + Fed Press Conference
- Thursday: PCE Price Index (Fed’s preferred inflation gauge), Q1 GDP Growth Rate (Advance), Personal Income/Spending, Jobless Claims, Fed Balance Sheet
- Friday: S&P Global Manufacturing PMI (Final), ISM Manufacturing PMI
The marquee events are Wednesday’s Fed rate decision and Thursday’s PCE and GDP prints. Markets will be laser-focused on whether the Fed signals any dovish tilt, how hot (or cool) inflation actually is, and whether the world’s largest economy is accelerating or slowing.
Why does this matter for Bitcoin?
Crypto is a high-beta risk asset. Dovish signals or softer inflation data tend to weaken the dollar and boost liquidity — historically bullish for BTC. Conversely, hotter-than-expected inflation or hawkish Fed commentary can trigger risk-off moves. With Bitcoin already in a strong uptrend, this week’s data could either fuel the next leg higher or spark a healthy (or not-so-healthy) pullback.
Bitcoin’s Technical Picture: Approaching a Major Confluence Zone
While the macro calendar sets the fundamental stage, the technical setup is equally compelling.
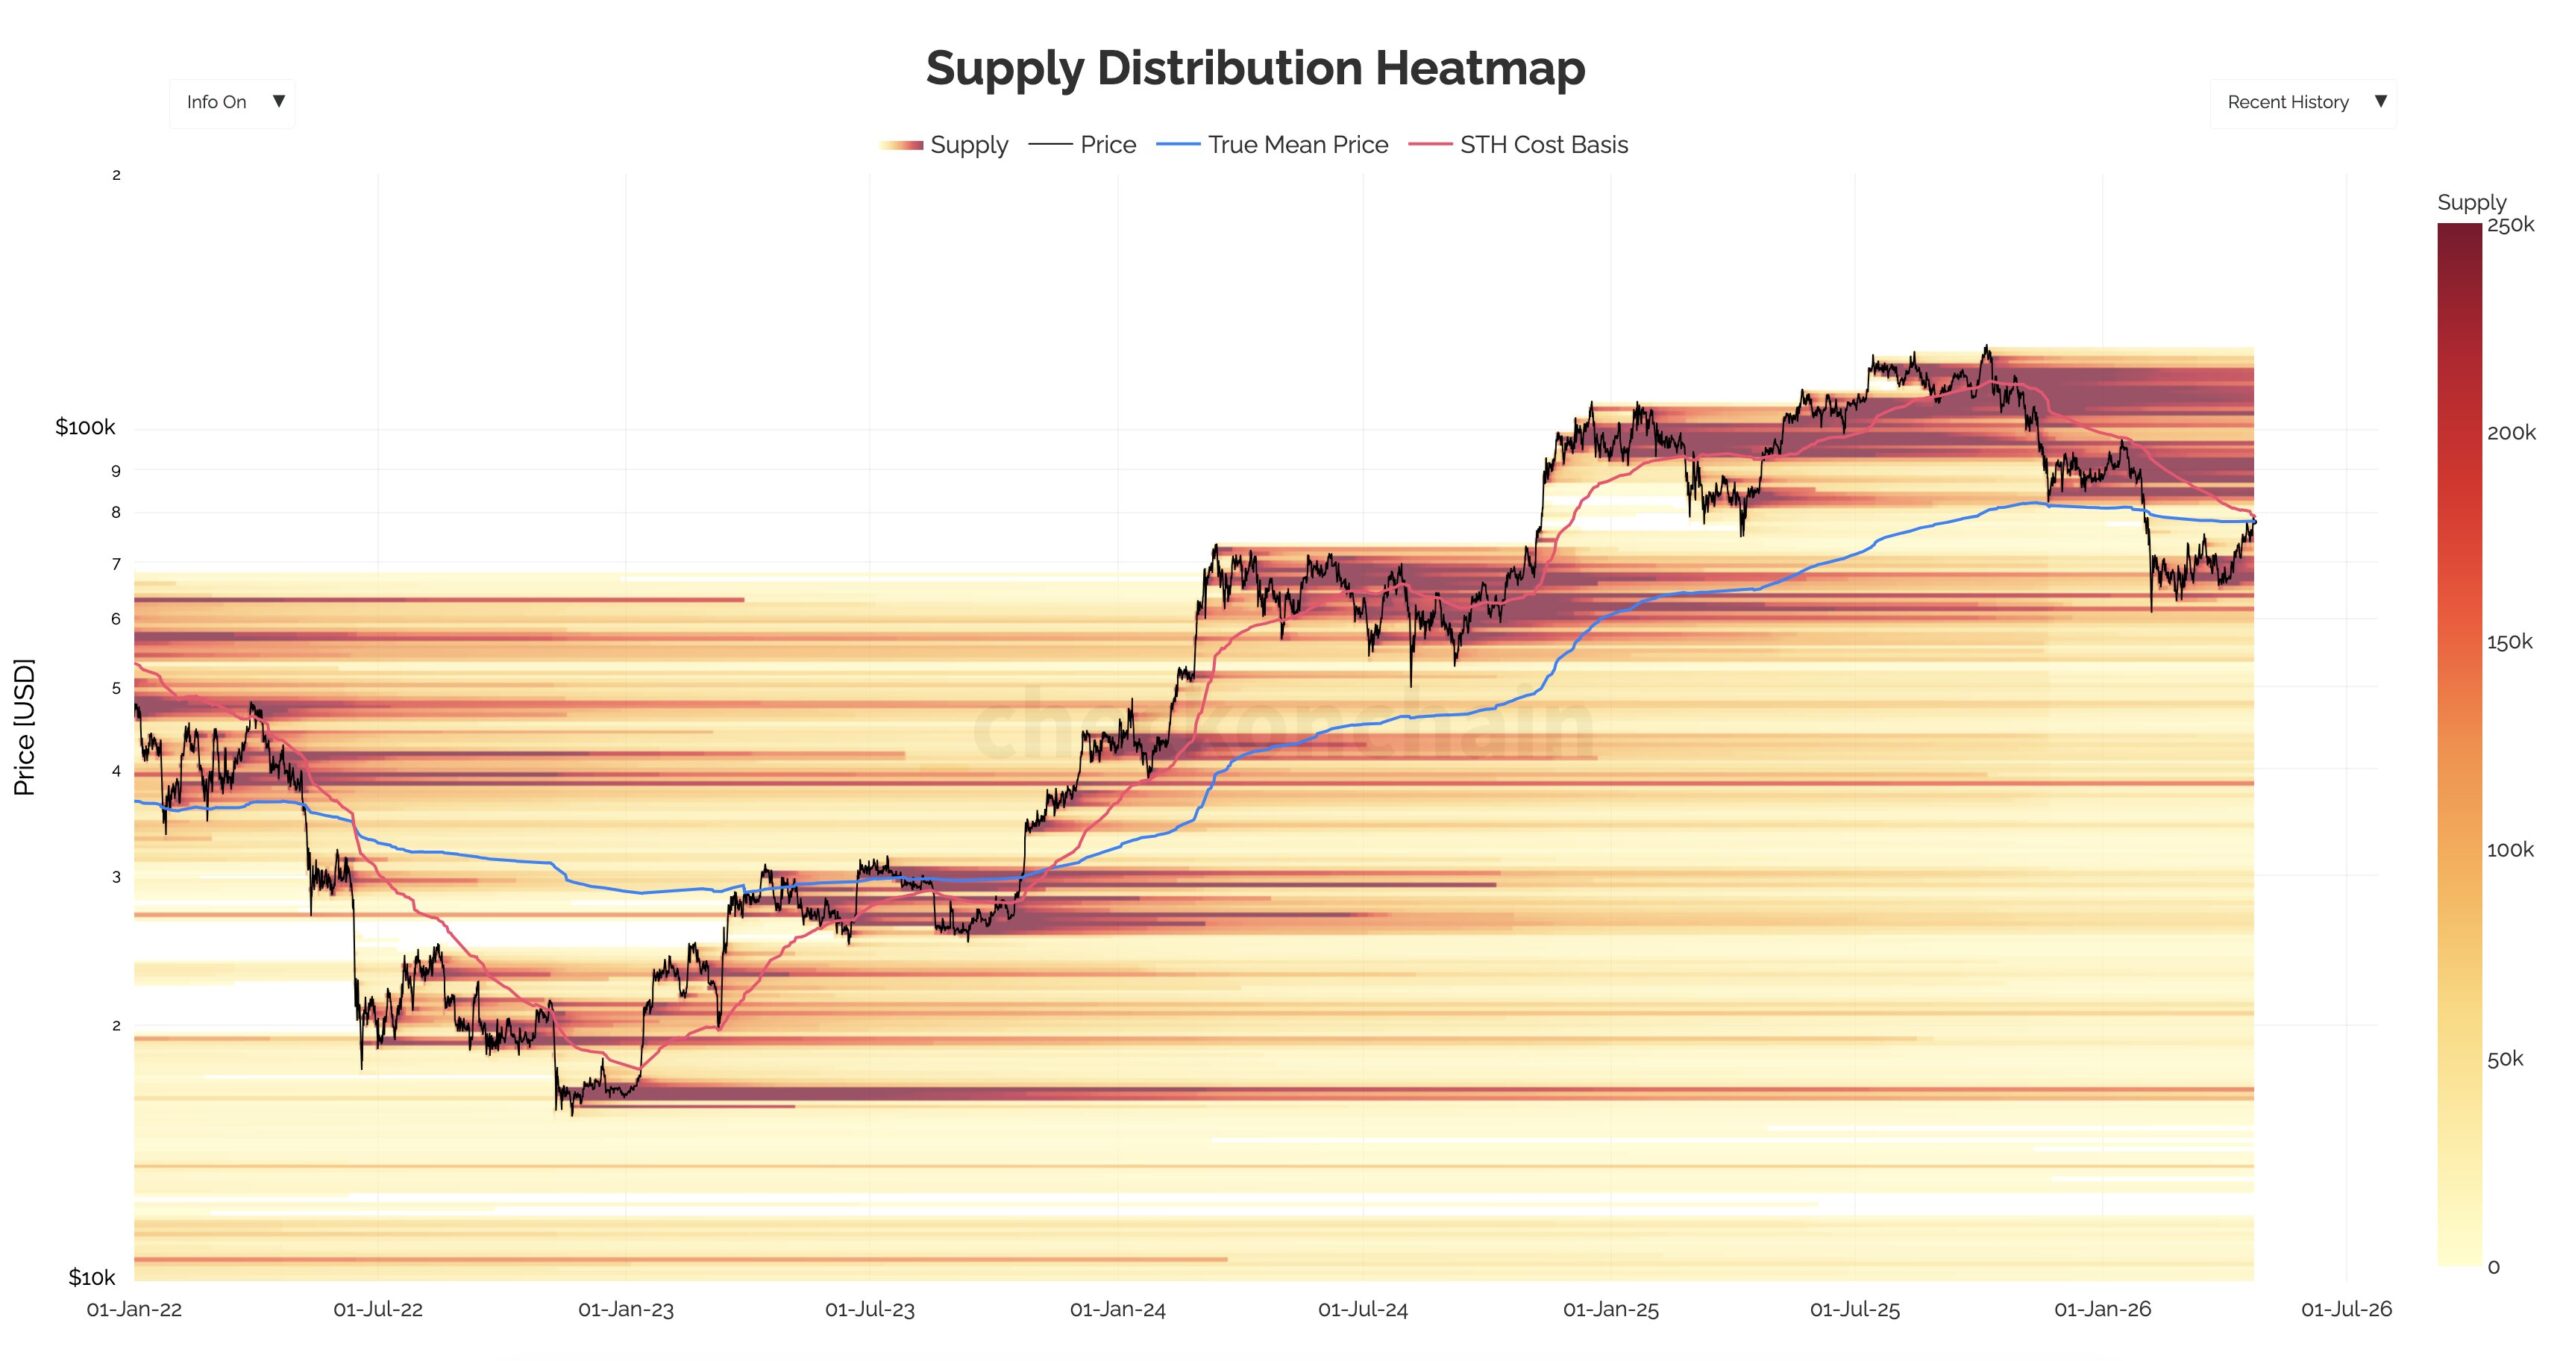
@Darkfost_Coc shared a detailed Supply Distribution Heatmap that overlays three powerful on-chain metrics:
- Distribution clusters (visualized as the heatmap intensity — showing where large volumes of BTC last changed hands)
- True Market Mean Price (blue line)
- Short-Term Holder (STH) Cost Basis (pink line)
Right now, Bitcoin is trading in a relatively “quiet” white zone on the heatmap — an area with limited historical exchange activity between roughly current levels and $83,000. Above that sits a dense band of previous buying/selling activity that could act as stiff resistance.
 Bitcoin Supply Distribution Heatmap/Source: @Darkfost_Coc (X)
Both the True Market Mean Price and STH Cost Basis are clustered around the $79,000 area, reinforcing this zone as a short-term ceiling. The analyst notes that their own adjusted STH Cost Basis (accounting for large Coinbase transfers) sits even closer to $83,000.
Key takeaway from the analyst:
“I believe BTC will need to test these levels soon, and its reaction there will be important to monitor.”
In other words, we are likely heading into a make-or-break test of this confluence zone. A clean breakout above $79k–$83k with strong volume would signal bullish continuation. Failure to hold or a rejection could lead to a retest of lower supports.
Related Analysis: On-Chain Signals Pointing to Seller Exhaustion
This latest technical setup builds on broader on-chain strength. For a deeper look at why many analysts believe Bitcoin has already confirmed a major bottom, check out our previous deep dive:Bitcoin Bottomed: 3 Powerful On-Chain Signals Confirm Sellers’ Exhaustion
What to Watch This Week
- Fed rhetoric on Wednesday — any hint of faster rate cuts or balance-sheet expansion would be music to crypto bulls’ ears.
- PCE on Thursday — if it comes in softer than expected, risk assets (including Bitcoin) should get a tailwind.
- BTC’s reaction at $79k–$83k — the heatmap suggests this is where the real battle will be fought.
- On-chain flows and exchange activity — watch for increased selling pressure if price stalls at these levels, or accumulation if buyers defend them aggressively.
Bottom Line
Bitcoin is in a sweet spot: strong momentum, a massive macro calendar that could deliver liquidity-friendly surprises, and a clearly defined technical confluence zone that will likely decide the near-term direction.Whether the week ends with BTC pushing toward all-time highs or pausing to digest gains will depend on how the Fed, inflation data, and the $79k–$83k resistance zone interact.
As analyst summarized, this is a week where both fundamentals and on-chain structure are aligning for a high-conviction move.
Frequently Asked Questions (FAQ)
What are the most important economic events for Bitcoin this week?
The biggest events are Wednesday’s Federal Reserve Interest Rate Decision, and Thursday’s PCE Price Index (core inflation) and Q1 GDP Advance print. These three will heavily influence market sentiment and liquidity.
Why is $83,000 a critical level for Bitcoin right now?
According to analyst, $79K–$83K represents a major confluence zone where the True Market Mean Price, Short-Term Holder Cost Basis, and dense supply clusters overlap, making it strong resistance.
How will the Fed decision affect Bitcoin price?
A dovish tone or signals of faster rate cuts would likely be bullish for Bitcoin as a risk asset. Hawkish commentary or hotter inflation data could cause short-term selling pressure.
Should I buy Bitcoin before or after this week’s macro data?
This is a high-volatility week. Many traders prefer to wait for the initial reaction to the Fed decision and PCE data before taking large positions, while long-term holders often use volatility to accumulate.
Disclaimer: The views and analysis presented in this article are for informational purposes only and reflect the author’s perspective, not financial advice. Technical patterns and indicators discussed are subject to market volatility and may or may not yield the anticipated results. Investors are advised to exercise caution, conduct independent research, and make decisions aligned with their individual risk tolerance.
Also Read: JASMY Nears Decision Point as Triangle Tightens — 30% Upside in Sight?
