


Chainlink: Supply Leaving, Institutions Entering – What Happens at $9.80
 APRIL
APRIL
 GRAYSCALE
 LINK
LINK
 EV
EV
 GMX
GMX
Key Takeaways
- LINK at $9.20, RSI 61.58.
- 19M LINK quarterly unlock hit exchanges on April 2 – 14.37M to Binance.
- Exchange reserve declined from 141M to 136.9M since April 2 .
- Swift concluded tokenized bond trials with European banks using Chainlink.
- Grayscale GLNK and Bitwise CLNK ETFs recording net inflows.
- Exchange reserve staying below 137M while price approaches $9.80 is the key condition to watch.
Chainlink is trading at $9.20 on April 15, up 1% on the day and $1 above its March 28 low of $8.20. The 50 SMA at $9.09 is rising and now $0.11 below price, the average that capped every rally attempt through late March is now acting as support. The RSI at 61.58 with the signal line trailing at 52.11 shows a 9.47-point gap, momentum is building, not normalizing. Price is not overbought. It has room before the level that matters.

That level is $9.80. It was the March 19 peak. It is the only prior high between current price and $10. Everything the on-chain data describes below points toward whether that level breaks or holds.
The April 2 Event
On April 2, Chainlink completedits regular quarterly unlock, moving 19 million LINK, worth approximately $165 million at the time, from three non-circulating supply addresses. Of that total, 14.375 million LINK worth approximately $125 million moved directly to Binance, while 4.625 million LINK worth $40.1 million moved to a multisig address used for staking rewards.
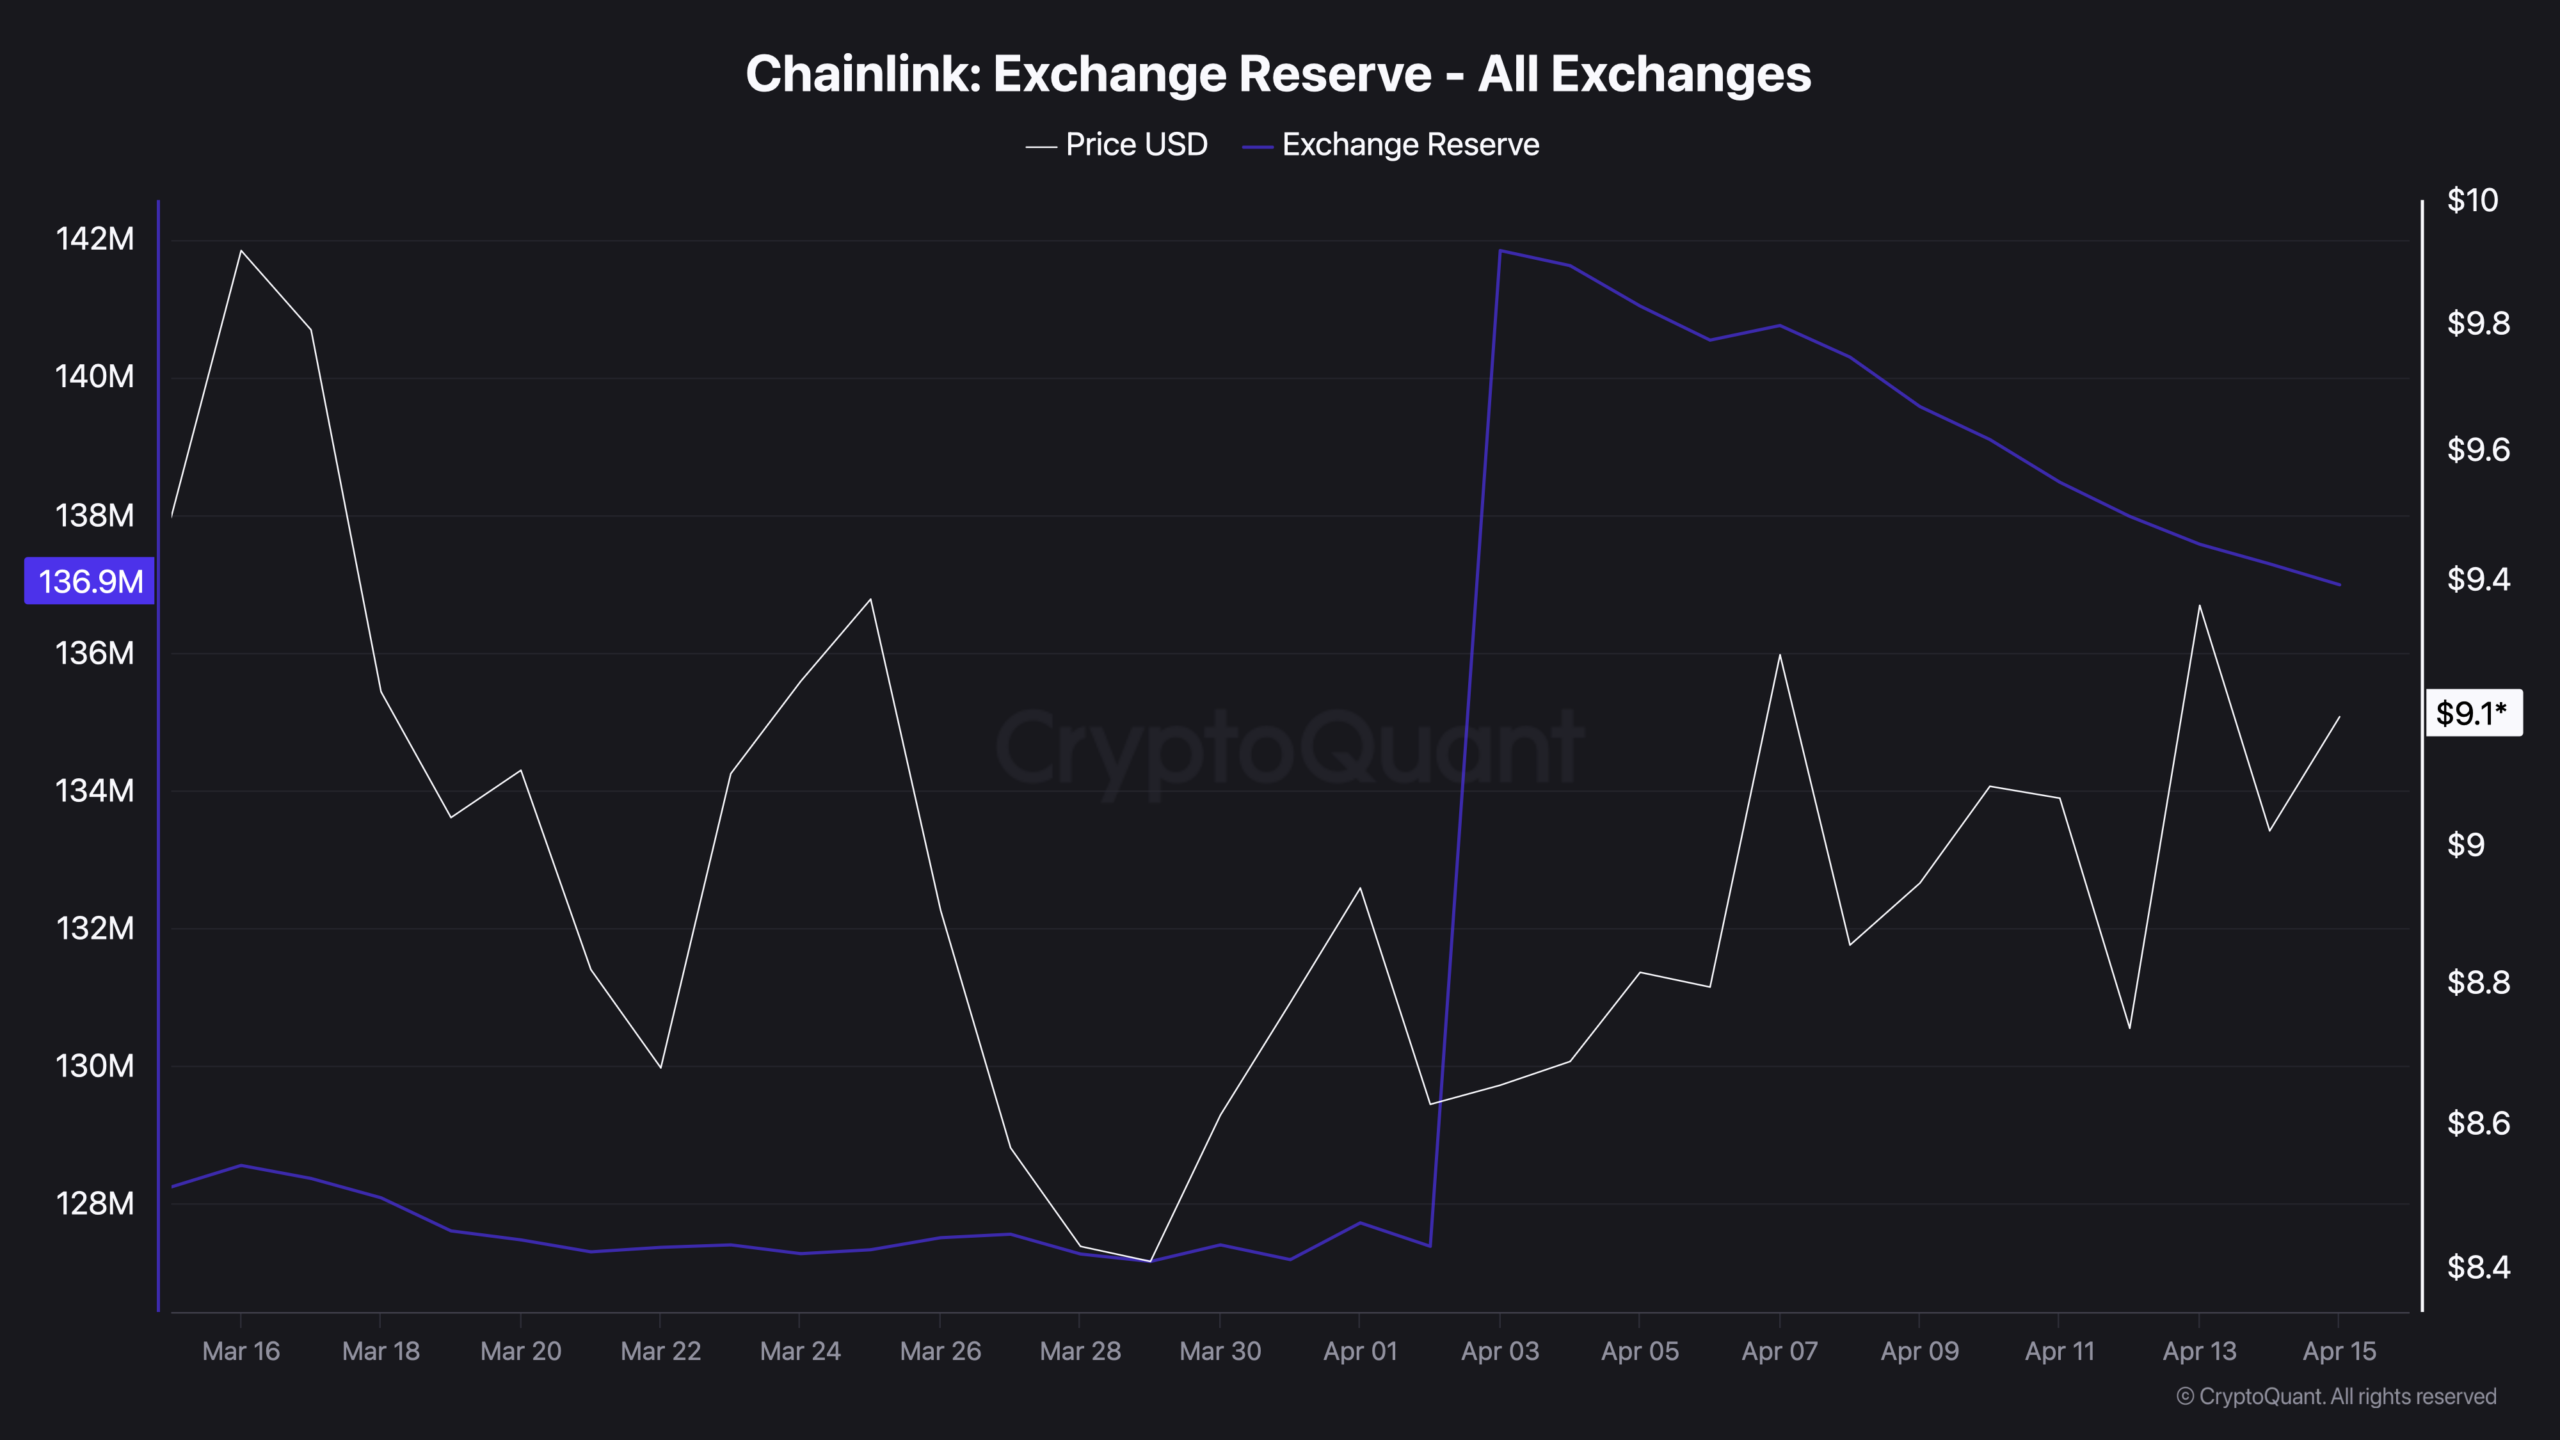
A quarterly unlock is a scheduled release of coins that were previously locked and not available to trade, pre-announced, expected by the market, and often feared because they represent new supply hitting the market on a fixed date regardless of price conditions. Chainlink follows this pattern approximately every three months. Exchange reserve jumped from 127M to 141M LINK that day. Price was sitting at $8.60–$8.80, near the bottom of the March selloff.
Quarterly unlocks are one of the most closely watched events in any token’s calendar because almost every time they are guaranteed selling pressure that the market cannot avoid, only absorb or front-run. The market had time to prepare for this one. What happened instead is the number that matters: price did not break lower after 19 million LINK worth $165 million hit exchanges. It held. Then it recovered. That is not the typical outcome of a large scheduled unlock into a market already sitting near its lows.
What Happened After
The signal that followed was cleaner than the unlock itself. Since the April 2 spike, 4.1 million of those 19 million LINK has moved back off exchanges into private wallets, meaning a portion of the unlocked supply was absorbed by buyers who then withdrew it into long-term custody rather than leaving it available to sell according to CryptoQuant data. When coins leave exchanges after an unlock, it means demand met the supply the unlock created and removed it from circulation. Exchange reserve has declined from 141M to 136.9M. The daily flow of LINK has been negative on almost every subsequent session – more leaving exchanges than arriving – with the current reading at -303.5K. Price has risen from $8.80 to $9.20 through this entire withdrawal period.

The pattern reads as follows: quarterly unlock hits near a price low, $165 million in new supply enters the market, demand absorbs it, coins begin leaving exchanges again, price rises. That sequence is the on-chain signature of institutional demand meeting known scheduled supply rather than supply overwhelming demand. The 19 million LINK that arrived on April 2 was not a surprise. The fact that it was absorbed without breaking price was.
The Activity Collapse
The broader exchange activity picture adds another layer. The number of individual transactions depositing LINK to exchanges has fallen to 173, near the 30-day low. The number of transactions withdrawing LINK has fallen to 309, also near the 30-day low. Both directions of exchange activity have collapsed simultaneously from March 16 peaks of 770 depositing and 970 withdrawing transactions.
![]()
When exchange activity falls in both directions but the net direction remains outflow, more leaving than arriving, it means the market is not actively trading LINK at scale, and the participants who are moving it are choosing to take it off exchanges rather than put it on. Fewer deposits and fewer withdrawals, with withdrawals winning, is the quiet version of supply compression. It does not announce itself. It simply reduces the coins available to sell, one withdrawal at a time.
The Institutional Picture
The on-chain data describes supply compressing. The institutional context explains where the demand absorbing that supply may be coming from.
In April 2026, Swift concluded tokenized bond trials with major European banks using Chainlink’s Cross-Chain Interoperability Protocol, the technology that allows different blockchains to communicate and settle with each other. The result of the trial was that legacy banks can now settle digital assets without rebuilding their existing financial infrastructure from scratch. The pipes that move trillions in traditional finance ran a successful live test on Chainlink rails. That is not a speculative catalyst. It is a named proof of concept with named counterparties and named volume.
Grayscale’s LINK Trust and Bitwise’s LINK ETF, both launched in late 2025 and early 2026, have been recording net inflows, meaning more money flowing in than out through regulated products that pension funds and asset managers can access without holding LINK directly on an exchange. Chainlink added 18 new integrations across 22 blockchain networks in a two-week period, with Aave, Coinbase, and GMX deepening their reliance on its price feed and cross-chain infrastructure.
The network now secures over $28 trillion in transaction value through real-world asset tokenization partnerships with Ondo Finance and Galaxy, meaning real financial assets like bonds and equities are being represented on-chain using Chainlink as the connection between the traditional and digital systems.
The April 2 unlock near the bottom reads differently against this backdrop. Institutional repositioning ahead of the Swift announcement and ETF inflow acceleration would produce exactly this pattern, a large deposit near a low, price holding, gradual withdrawal as positions are built through regulated products rather than spot exchange sales.

What Happens at $9.80
If LINK holds the $9.09 SMA and RSI continues building toward 70 without exchange reserve reversing higher, the recovery structure stays intact and $9.80 becomes the first real test. At that level, whatever overhead supply remained from the April 2 quarterly unlock meets the momentum the on-chain withdrawal trend has been building since.
A clean break above $9.80 on declining exchange reserve and continued negative netflow, more LINK leaving exchanges than arriving, would confirm the supply compression thesis. The 14.375 million LINK that went to Binance on April 2 was absorbed without breaking price. If the withdrawal trend holds through $9.80, that absorption was real and the institutional demand from Swift CCIP and ETF inflows is outpacing the supply the quarterly unlock created.
If exchange reserve starts rising again before $9.80 is reached, netflow flipping positive, meaning more LINK moving onto exchanges than off, the remaining unlock supply reframes as an unresolved overhead ceiling. The $9.20–$9.25 resistance level becomes the cap, the RSI rolls over from 61 before reaching overbought territory, and the recovery stalls at exactly the level it needs to clear to confirm the structural shift.
The on-chain data cannot tell you which scenario plays out. It can tell you what to watch. Exchange reserve is the leading indicator. If it stays below 137M while price approaches $9.80, the setup is intact. If it rises back toward 141M before price gets there, the April 2 question has already been answered, and not in the direction the withdrawal trend suggested.
The information provided in this article is for educational purposes only and does not constitute financial, investment, or trading advice. Coindoo.com does not endorse or recommend any specific investment strategy or cryptocurrency. Always conduct your own research and consult with a licensed financial advisor before making any investment decisions.
The post Chainlink: Supply Leaving, Institutions Entering – What Happens at $9.80 appeared first on Coindoo.
